
Figure 4.
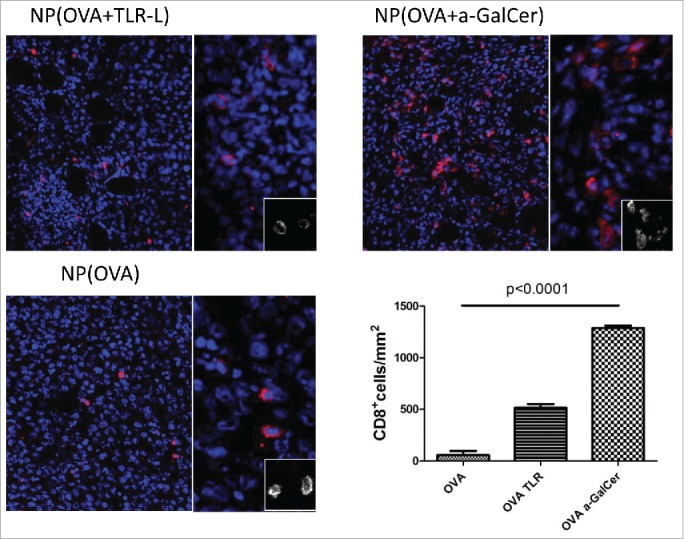
Intratumoral T cell infiltration after therapeutic vaccinations. Similar sized tumors were isolated 8 d after first vaccination. Frozen tumor tissues were screened for CTL infiltration by CD8+ (red) and DAPI (Blue) staining by Vectra automated quantitative imaging system. NP(OVA), n=2; NP(OVA+TLR-L), n=4; NP(OVA+α-GalCer), n=2.