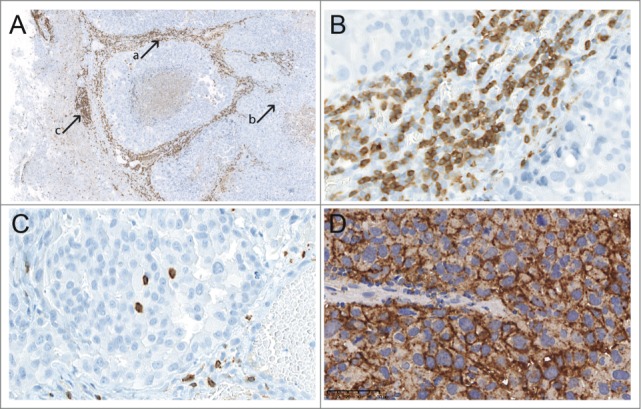
Figure 2.

A TIL distribution between different areas (CD3+ TILs, magnification ×5); B TIL density within the tumor stroma (CD3+ TILs, magnification ×200); C TIL density within the solid tumor (CD3+ TILs, magnification ×200); D PD-L1 expression in a melanoma BM (magnification ×200).
