
Figure 1.
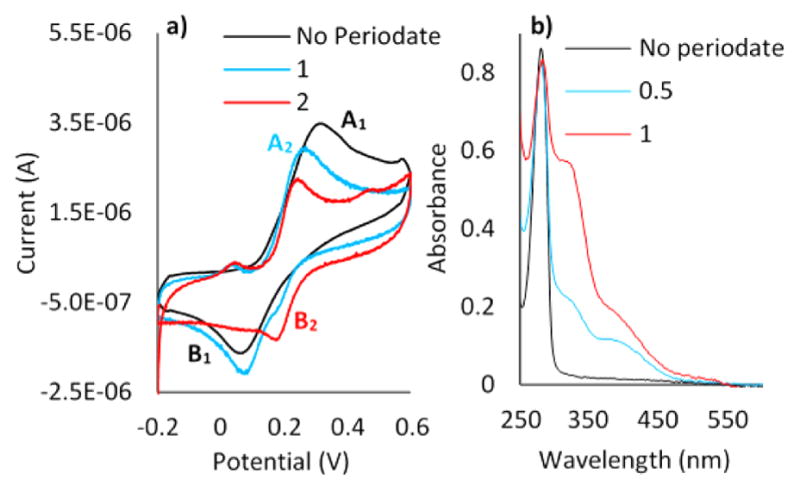
(a) CV of the CPE electrode in 5 × 10⁻⁵ M D in 0.1 M PBS (pH 7), with a scan rate of 0.05 V s−1. (b) UV–vis spectra for oxidation of 8 × 10⁻⁴ M D in 0.1 M PBS (pH 7). The blue curve in panel a) denotes a 1:1 periodate:Dopa ratio, whereas the red curve denotes a 2:1 ratio. In panel b), the blue and red curves denote 0.5:1 and 1:1 periodate: Dopa ratios, respectively.