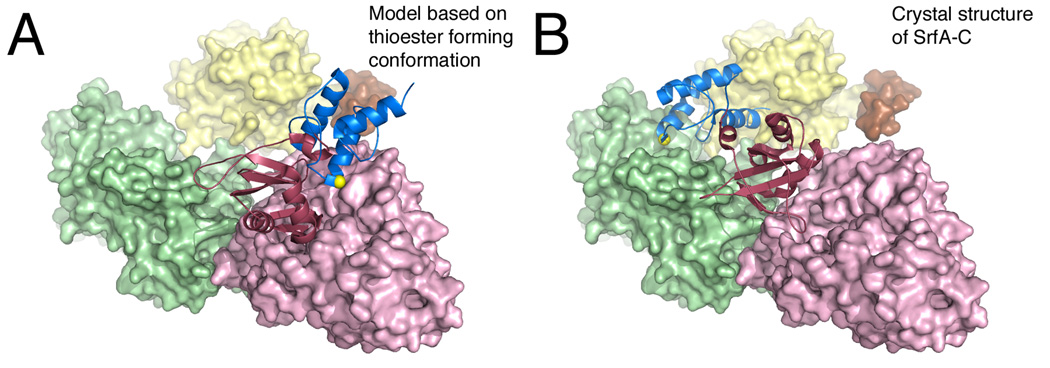
Figure 8.
Model for the delivery of the PCP to the adenylation domain active site. The SrfA-C protein is shown in A. A model conformation that adopts the thioester-forming conformation where the PCP is bound to the adenylation domain and B. the crystallographic structure where the PCP interacts with the condensation domain. The N-terminal subdomain of the adenylation domain, as well as the condensation and thioesterase domains, are all shown in surface representation, while the PCP and the C-terminal subdomain of the adenlyation domain are shown as ribbons. The structure in panel A is derived by modeling the SrfA-C (PDB 2VSQ) adenylation and PCP domains onto the thioester-forming conformation observed with EntE-B (PDB 4IZ6) or PA1221 (PDB 4DG9). The serine residue that is the site of phosphopantetheinylation is highlighted with the yellow sphere.

