Fig. 5.
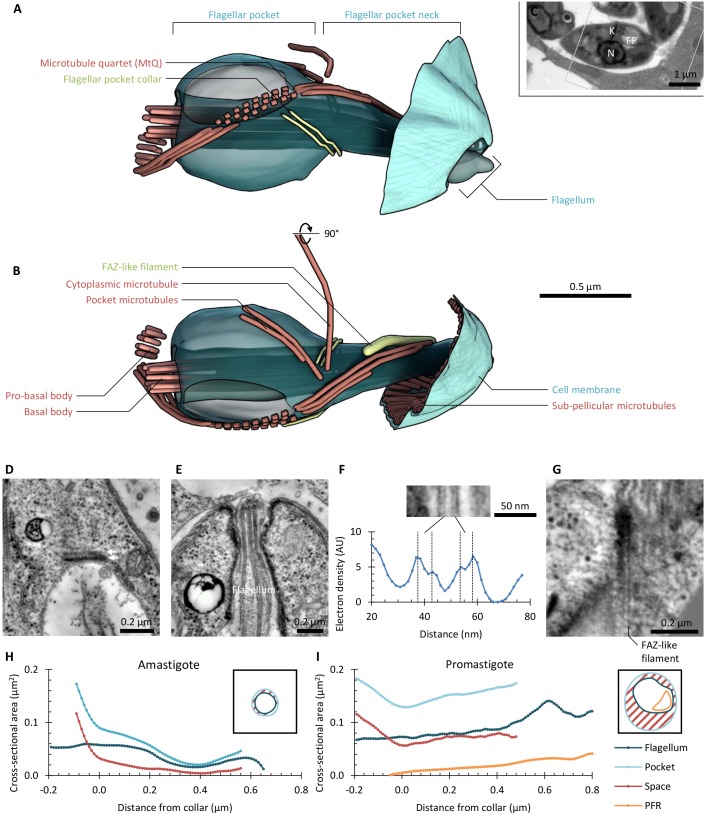
Adaptation of the L. mexicana flagellar pocket and FAZ structures in the amastigote. (A) Lateral view of the flagellar pocket structure of a representative amastigote 1K1N L. mexicana cell (see C), as determined using serial section electron tomography. Flagellum, flagellar pocket and associated structures are shown, relative to a small portion of the pellicular microtubules and membrane. The inferred path of the MtQ out of the tomogram volume is indicated with dashed structures. Generated from Tomogram AL2. (B) The structure shown in A rotated 90° around the horizontal axis. (C) Low-magnification electron micrograph of the cell whose flagellar pocket is shown in A and B. Section 1 of the three used to build the tomogram is shown. The location of the nucleus (N), kinetoplast (K), flagellar pocket (FP) and region reconstructed by using electron tomography (box) are indicated. (D–G) 10-nm virtual longitudinal sections (generated from tomogram volumes), illustrating electron densities corresponding to key structures in the flagellar pocket neck region. D and G are tangential to the flagellar membrane, E and F are perpendicular. Oriented with distal upwards. (D) The double line of the flagellar pocket collar (arrows). Tomogram AL2. (E) The flagellum embedded in the attachment area. Tomogram PL2. (F) Detail of the typical flagellum and flagellar pocket membrane spacing in the attachment area, and quantitation of the corresponding electron density profile. Both lipid bilayers can be seen, separated by ∼10 nm. Generated using tomogram PL1. (G) The electron-dense FAZ filament and neighbouring electron densities. Digitally straightened from tomogram AL3. (H,I) Cross-sectional area of the flagellum and flagellar pocket, and remaining space allowing entry to the flagellar pocket, for a representative amastigote and promastigote. The small cartoon cross-sections illustrate the areas measured. Generated using tomograms PL1 and AL2, respectively.

