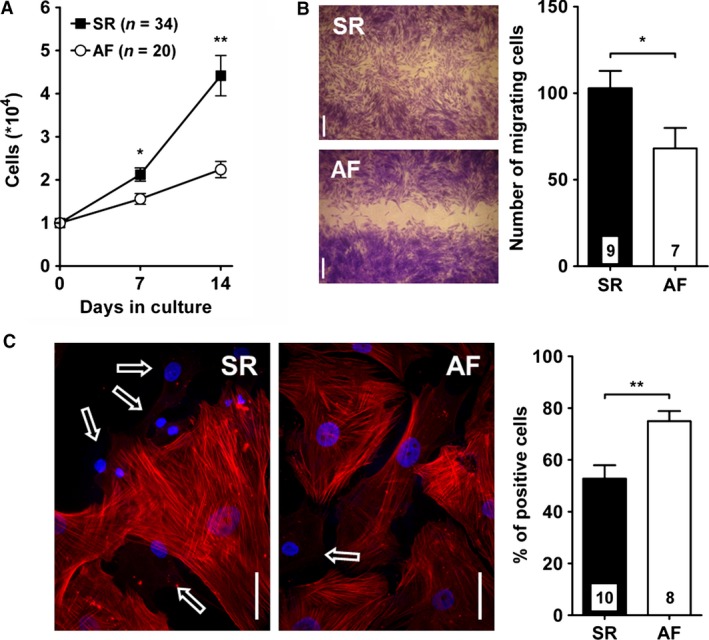
Figure 2.

Proliferation, migration, and differentiation of cultured fibroblasts. (A) Cells were counted after 7 and 14 days of culture following replating (SR, n = 34; AF, n = 20). (B) Migration was assessed using a wound healing assay (see Material and Methods). Left panel: example of the gap closure after 24 h. The graph summarizes the number of cells closing the gap. (C) Differentiation of fibroblasts into myofibroblasts was evaluated by staining the cells for α‐smooth muscle actin (α SMA). Left panel: cells expressing α SMA‐positive filaments are easily distinguished from negative cells (arrows). Right panel: The graph summarized the fraction of cells positive for α SMA. *P < 0.05, **P < 0.01, unpaired Student's t‐test.
