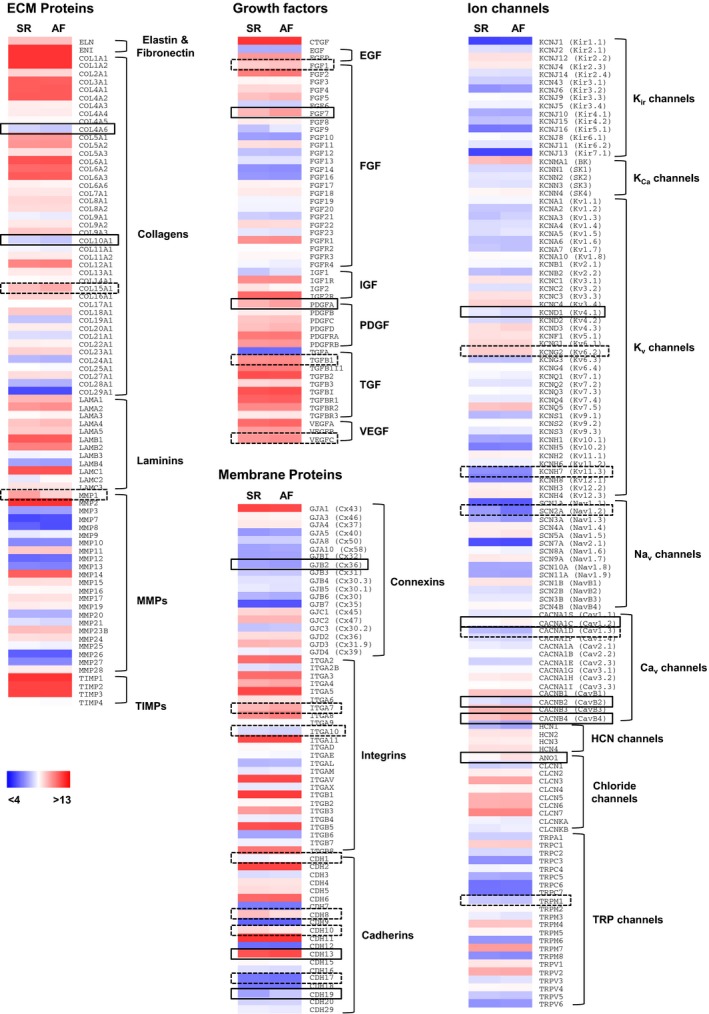
Figure 3.

Gene expression of major ECM components, growth factors, membrane proteins, and ion channels in cultured fibroblasts. Gene expression was quantified in SR (n = 8) and AF (n = 5) fibroblasts 2 weeks after replating using an Affymetrix GeneChip array (see Material and Methods). Colors represent log2‐transformed expression levels from low (blue) to high (red) levels. Boxes denote significant (solid line, P < 0.05) and nonsignificant (dotted line, 0.05 < P < 0.1) differences between SR and AF. Absolute expression levels, fold change, and P values are given in Table S1.
