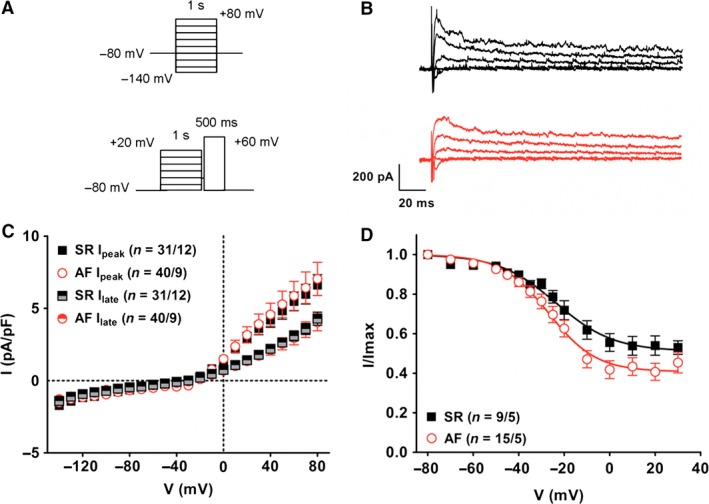
Figure 5.

Outward rectifier currents in cultured fibroblasts. (A) Voltage‐step protocols for current activation (top) and steady‐state inactivation (bottom). (B) Examples of currents recorded at different potentials in a SR (black) and AF (red) fibroblast. [K+]o = 5.4 mmol/L. (C) Current–voltage relationship of outward peak and late currents. (D) Steady‐state inactivation of outward peak currents. A Boltzmann function was fitted to the data points (see Material and Methods). Fitting parameters are given in Table 3.
