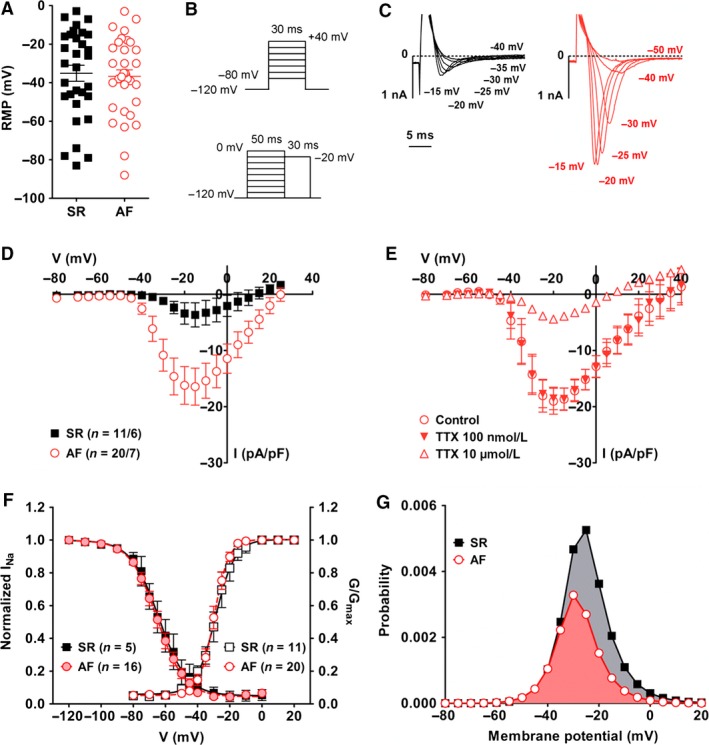
Figure 7.

Sodium currents in cultured fibroblasts. (A) Resting membrane potential (RMP) was measured in cells from seven SR patients and six AF patients. (B) Voltage‐step protocols for current activation (top) and steady‐state inactivation (bottom). (C) Examples of currents recorded at the indicated potentials in a SR (black) and AF (red) fibroblast. (D) Current–voltage relationships. (E) Effect of 100 nmol/L and 10 μmol/L tetrodotoxin (TTX) on Na+ currents measured in AF fibroblasts (n = 4/2). (F) Activation (SR: black empty squares, n = 11/6; AF: red empty circles, n = 20/7) and steady‐state inactivation (SR: black filled squares, n = 5/3; AF: red filled circles, n = 16/6) of Na+ currents measured in AF fibroblasts. Activation curves were calculated as normalized conductance values from the IV curves assuming a reversal potential of +78 mV. A Boltzmann function was fitted to the data points (see Material and Methods). Fitting parameters are given in Table 3. (G) Window current in SR and AF fibroblasts calculated as the product of the activation and inactivation functions (Huang et al. 2011).
