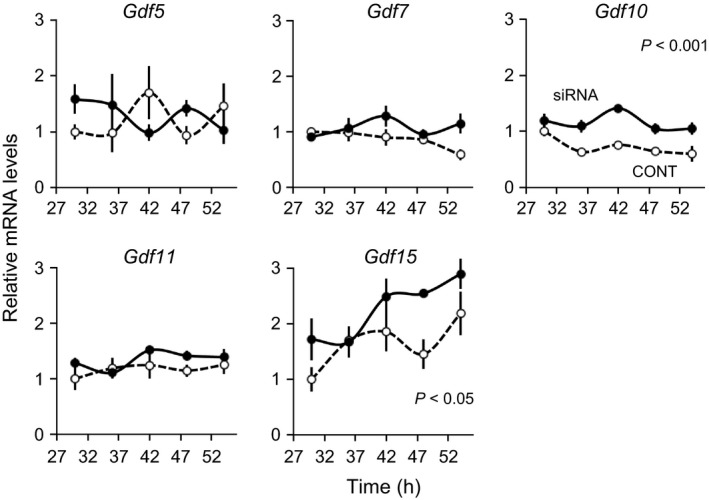
Figure 6.

Expression profiles of core Gdf genes in UESCs transfected with Bmal1‐specific siRNA or nonsilencing RNA. According to the first Per2‐dLuc phase shown in Figure 5A, total RNA samples were collected from control (dot line) and decidual (solid line) cells at the indicated times after synchronization. RT‐qPCR analyses of transcript levels were performed using their specific primers for Gdf5, Gdf7, Gdf10, Gdf11, and Gdf15. The transcript levels were calculated and normalized to each value given by the control sample at 30 h.
