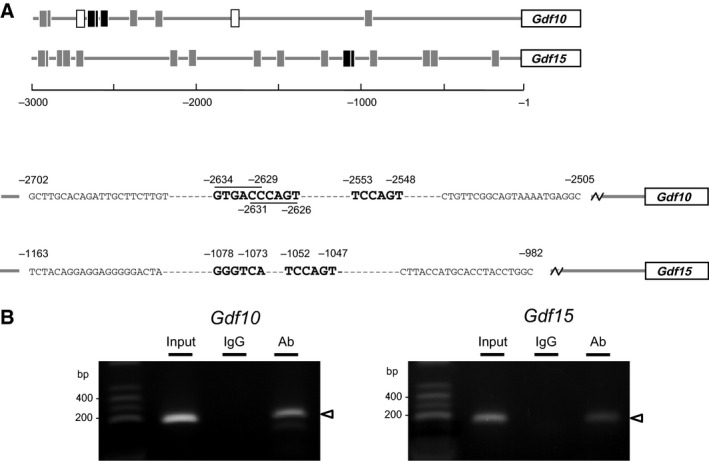
Figure 9.

ChIP‐PCR analysis of the putative RORE sites in upstream regions from transcriptional start sites of Gdf10 and Gdf15. (A) The putative RORE (black and gray squares) and E‐box sites (open squares) located in upstream regions from transcriptional start sites of Gdf10 and Gdf15 are listed, and distal and proximal sites were analyzed, respectively (black squares). Three and two putative RORE sites (gothic letters), GTGACC −2634/−2629, CCCAGT −2631/−2626, and TCCAGT −2553/−2548 for Gdf10 and GGGTCA −1078/−1073 and TCCAGT −1052/−1047 for Gdf15, located in upstream regions from transcriptional start sites of Gdf10 and Gdf15 were targeted, respectively. Purified DNA was amplified by PCR with specific primer sequences (small letters) (B) Confluent UESCs (3.8 × 10⁶ cells) were synchronized with DXM, and then harvested at 48 h and fixed with formaldehyde to cross‐link proteins to DNA as described in Materials and Methods. The extracted genome DNA was digested with Micrococcal Nuclease into fragments. After DNA purification, the cross‐linked chromatin (2 μg) was used for immunoprecipitation using REV‐ERB α antibody and normal rabbit IgG (negative control). Purified DNA was amplified with specific primer sets for Gdf10 and Gdf15. Input, input sample; IgG, negative control; Ab, anti‐REV‐ERB α antibody.
