
Figure 2.
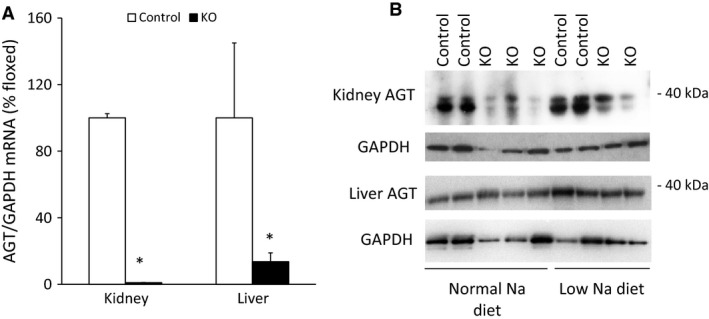
AGT mRNA and protein expression in control and AGT KO mice. (A) AGT mRNA expression by RT‐PCR in liver and kidney (N = 6–8/group), values are adjusted to control levels (100%); (B) AGT protein by Western blot in kidney and liver (N = 3/group). *P < 0.05 versus control mice.