
Figure 3.
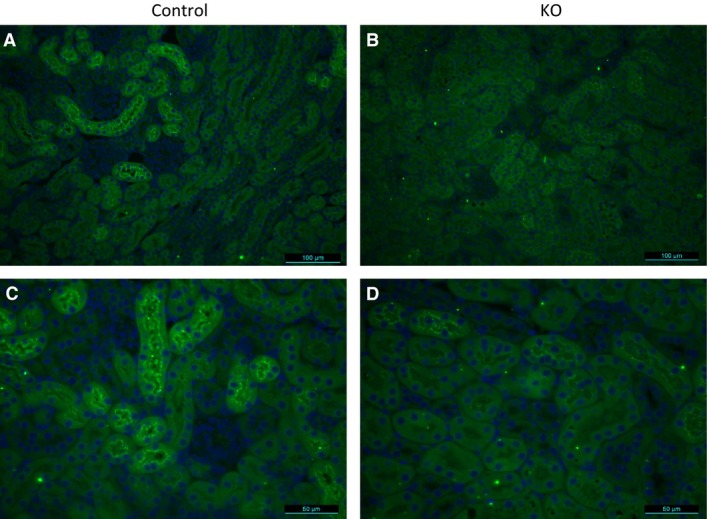
Immunostaining of kidney sections with anti‐AGT antibody (green) from control (A and C) and PRR KO mice (B and D). Images are representative of three different mice. (A and B) are 200× and (C and D) are 400× magnification.
Official websites use .gov
A
.gov website belongs to an official
government organization in the United States.
Secure .gov websites use HTTPS
A lock (
) or https:// means you've safely
connected to the .gov website. Share sensitive
information only on official, secure websites.
Immunostaining of kidney sections with anti‐AGT antibody (green) from control (A and C) and PRR KO mice (B and D). Images are representative of three different mice. (A and B) are 200× and (C and D) are 400× magnification.