
Figure 5.
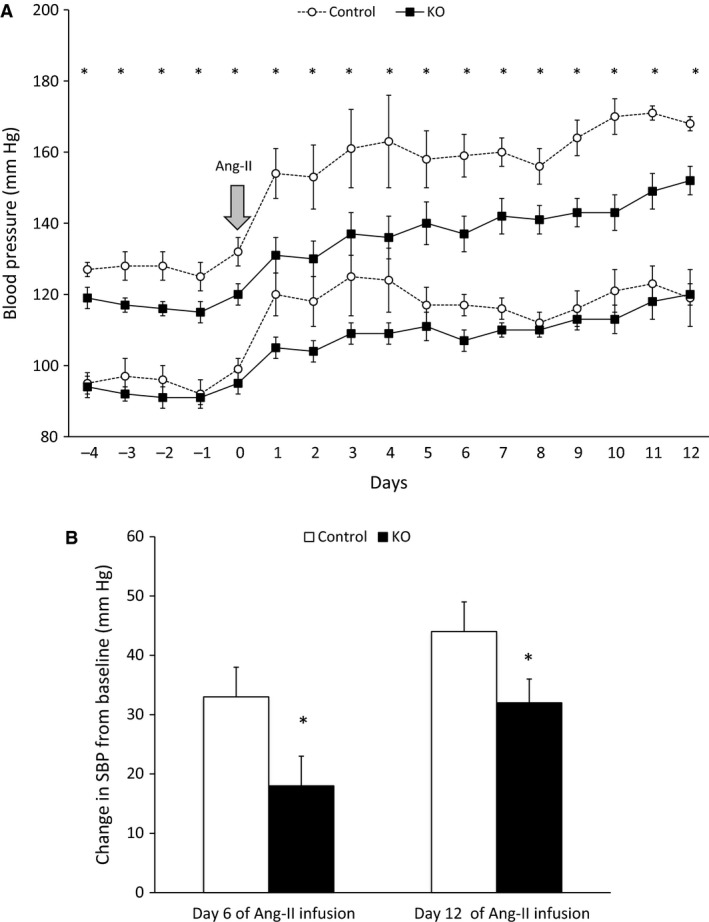
Daily BP in control and AGT KO mice during 14‐day Ang‐II infusion (400 ng/Kg/min). (A) BP was measured via telemetry and mice were fed a normal Na+ diet (N = 6–8/group). Top two lines show systolic, and bottom two lines show diastolic BP; (B) Change in systolic BP from baseline, following Ang‐II infusion (N = 6–8 group). *P < 0.05 versus control mice.