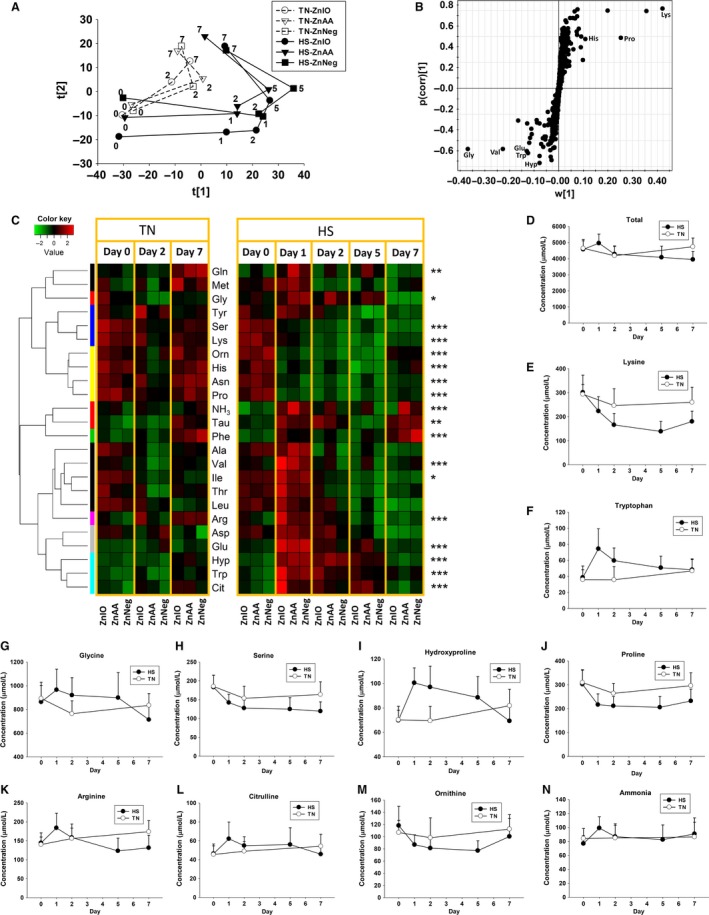
Figure 3.

Metabolomic analysis of amino‐containing metabolites in serum during 1‐week HS and Zn supplementation. Amino‐containing metabolites were derivatized by DC prior to LC‐MS analysis. (A) The scores plot from PCA analysis on serum metabolome. The t[1] and t[2] values of each data point are the average scores of eight samples in principal components 1 and 2 of the model, respectively. These eight samples were harvested from the same treatment group on specified dates (marked in the plot) between day 0 and 7. (B) The S‐loadings plot on the ions contributing to the separation of HS and TN samples in an OPLS‐DA model. Major contributing metabolites are labeled. (C) The heat map on serum amino‐containing metabolites during 1‐week HS and Zn supplementation. The metabolites were grouped by HCA. Concentrations of each metabolite at different time points and in different sample groups were compared by its Z scores and are presented according to inlaid color keys. Significant differences between day 0 and day 1 in HS groups are determined by the Student's t‐test and labeled as *P < 0.05, **P < 0.01, and ***P < 0.001. (D) The concentrations of total AAs in HS and TN groups. (E–N) The concentrations of lysine, tryptophan glycine, serine, hydroxyproline, proline, arginine, citrulline, ornithine, and ammonia in serum, respectively.
