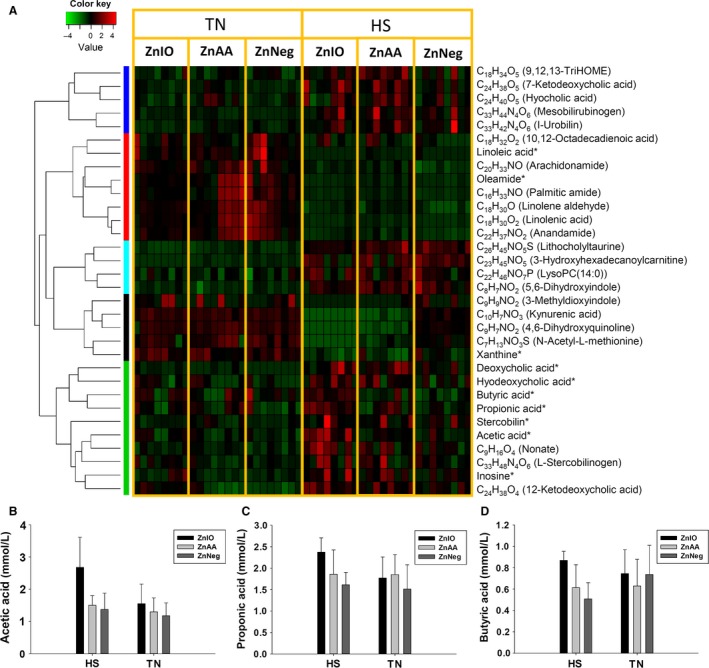
Figure 7.

Metabolite markers of HS and Zn supplementation from LC‐MS‐based metabolomic analysis of cecal fluid. The markers labeled with * were confirmed with authentic standards. Putative identities of other markers were based on database search. (A) The heat map of cecal metabolite markers. The metabolites are grouped by HCA. Relative abundances of each metabolite across sample groups are converted to the Z scores and presented in the heat map according to inlaid color keys. (B) The concentration of acetic acid in cecal fluid. (C) The concentration of propionic acid in cecal fluid. (D) The concentration of butyric acid in cecal fluid.
