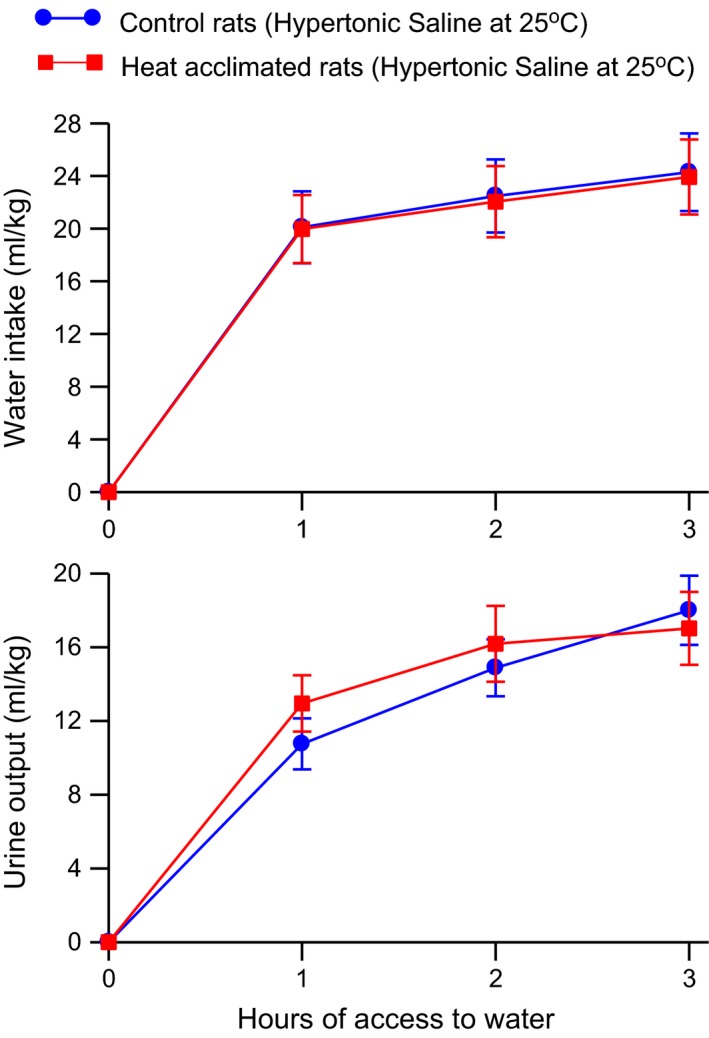
Figure 5.

Mean ± SE cumulative water intake (top) and urine output (bottom) of control and heat‐acclimated rats for 3 h of access to water at an environmental temperature of 25°C following administration of 10 mL 0.75 mol/L NaCl/kg i.p. n = 6 per group. ANOVA indicated only significant effects of time on water intake and urine output.
