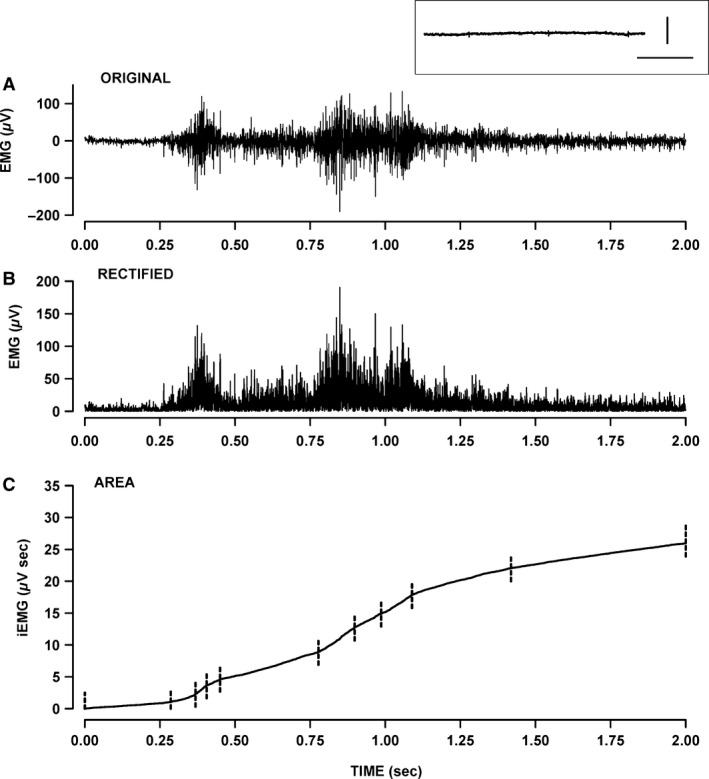
Figure 4.

Measurement of integrated electromyographic (iEMG) from gastrocnemius. EMG was measured while the mouse moved freely in its cage. (A) Example of an original EMG trace over a 2‐sec recording. (B) Rectified EMG trace. (C) Calculated iEMG. The rate at which iEMG increased over time (diEMG/dt) varied constantly. The iEMG trace was then divided in segments as shown with the vertical dashed lines. For each segment, we calculated the slope (i.e., diEMG/dt) by linear regression analysis and its duration. Inset above A: example of an EMG trace after the mouse had been anesthetized; a similar trace was obtained if the leg was moved. Horizontal bar: 200 msec; vertical bar: 1 μV.
