
Figure 5.
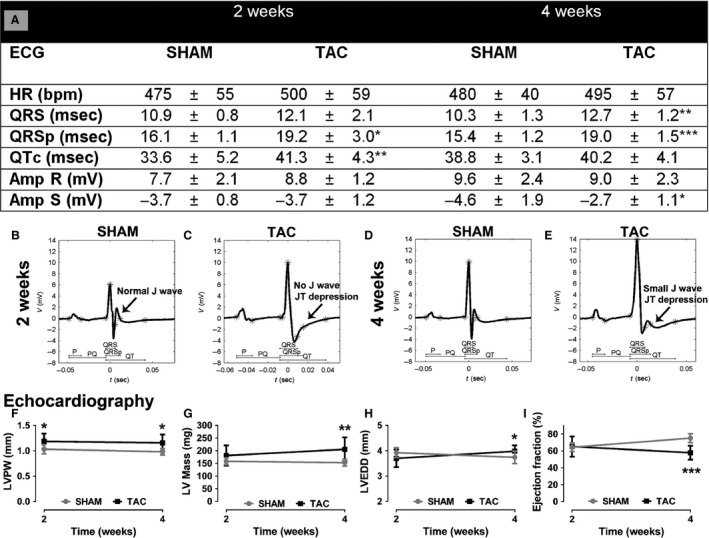
ECG and echocardiographic findings in progressive left ventricular hypertrophy at 2 and 4 weeks after the TAC operation. ECG measurements (A), representative surface ECGs of sham (B, D), and TAC operated (C, E) mice. Echocardiographic measurements of LVPW (F), LV mass (G), LVEDD (H), and ejection fraction (I). Results are expressed as mean ± SD. Student's paired t‐test was used to compare the sham‐ and TAC‐operated groups within a timepoint, *P < 0.05, **P < 0.01, ***P < 0.001. n = 8–10 mice/group.