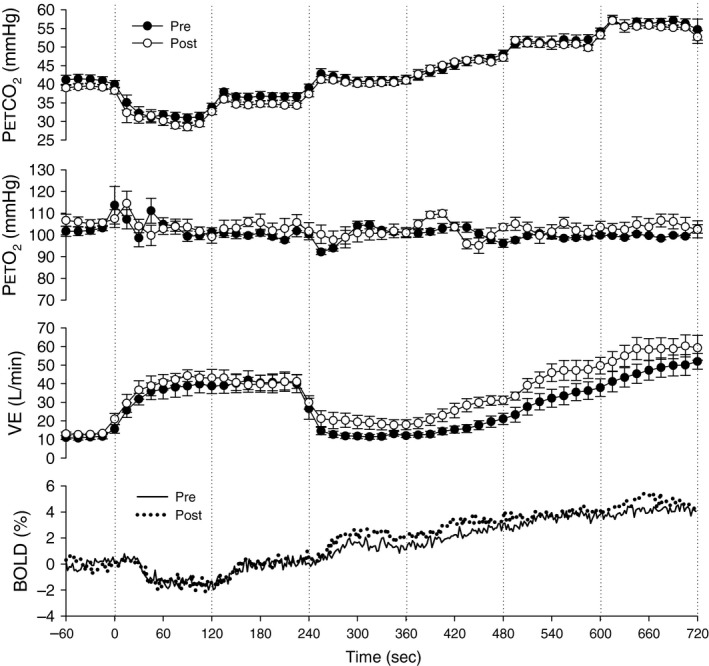
Figure 1.

Group mean ventilatory and cerebral vascular response to the vascular reactivity test evoked by stepwise changes in CO 2 before (PRE) and after (POST) exposure to high‐altitude hypoxia. % BOLD is displayed as the mean BOLD signal for the brainstem for the entire group (n = 6) at 2 sec intervals, whereas the remaining data points are displayed as 30 sec mean ± SE for the group (n = 6). The vertical dotted lines define each step change in CO 2. pet CO 2, end‐tidal partial pressure of carbon dioxide; petO2, end‐tidal partial pressure of oxygen; V̇E, minute ventilation; % BOLD, the blood oxygen level‐dependent signal expressed as percent change from baseline.
