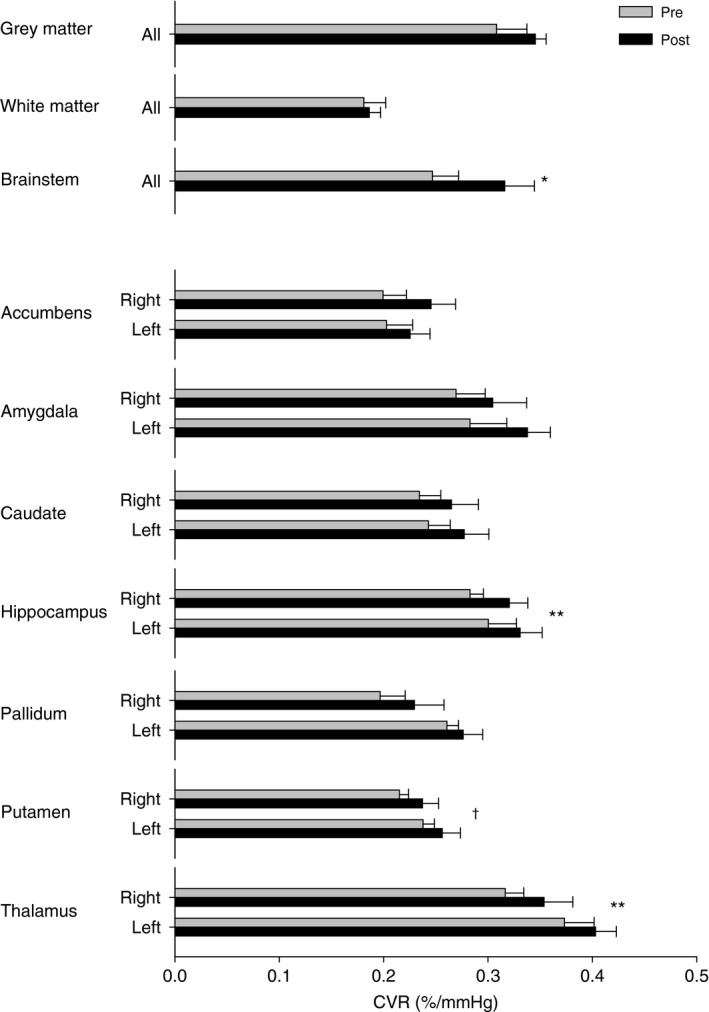
Figure 3.

Displays the cerebral vascular reactivity (CVR) of different subcortical structures before (Pre) and after (Post) exposure to high‐altitude hypoxia. Where appropriate structures have been separated into left and right hemispheres. Values are mean ± SE. *P < 0.05 Pre versus Post; ** P < 0.01 Pre versus Post; † P < 0.05 Left versus Right.
