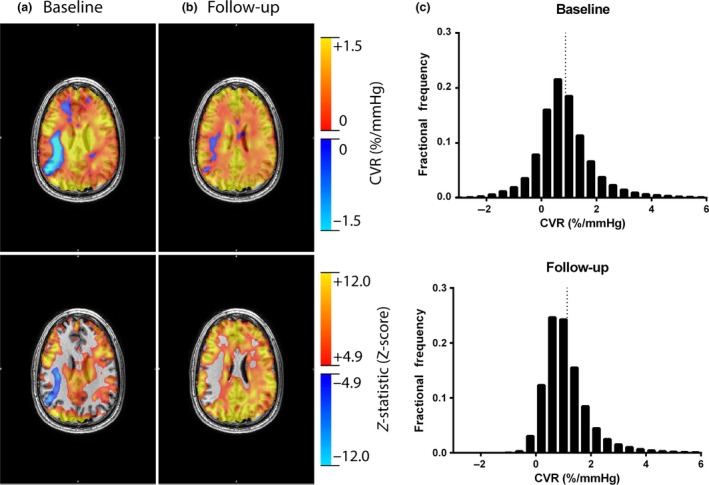
Figure 5.

An individual CVR response before and following high‐altitude exposure. Displays cerebral vascular reactivity (CVR) maps and z‐statistic maps resel‐corrected to P < 0.05 for one individual subject before (A) and following (B) exposure to high altitude. Note the decrease in the degree of negative CVR following exposure to high altitude. The CVR for each voxel was then extracted and a fractional frequency distribution at baseline and follow‐up was generated to illustrate the reduction in voxels responding in the negative direction. The dotted vertical lines mark the mean CVR for each distribution.
