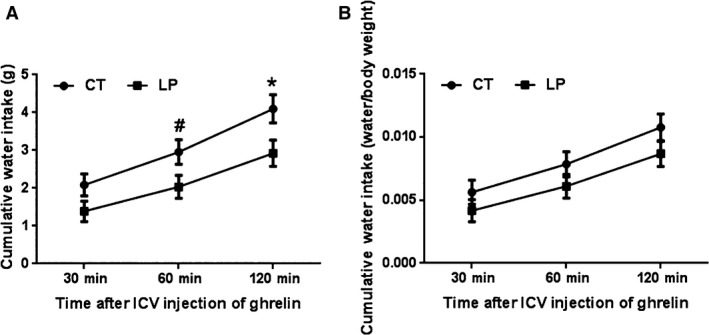
Figure 2.

Water intake after intracerebroventricular (ICV) injection of ghrelin. CT, control; LP, low‐protein diet. Data represents the mean ± SEM expressed as the absolute water weight (gram) (A) or the ratio of water intake (gram) to body weight (gram) of pregnant rats on each day of pregnancy (B) (n = 8–10). *P < 0.05; #0.05 < P < 0.1.
