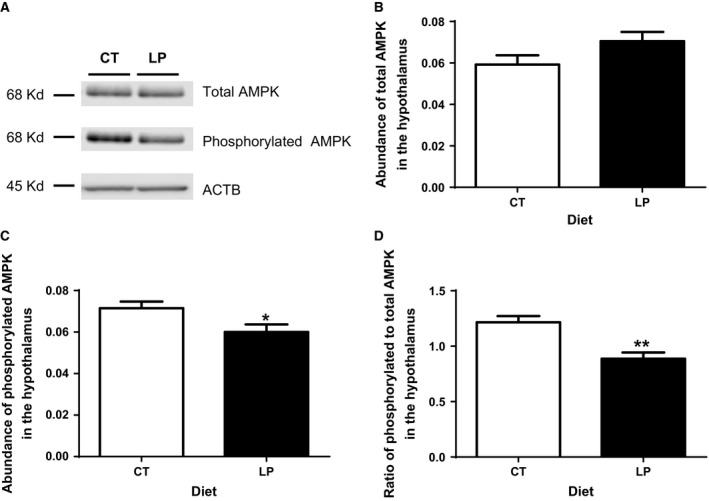
Figure 4.

Western blotting analysis of phosphorylation of AMPK in the hypothalamus after intracerebroventricular injection of ghrelin.(A) A single band in a size of 68 kD for total and phosphorylated AMPK was detected. (B) The relative abundance of total AMPK. (C) The relative abundance of phosphorylated AMPK. (D) The ratio of abundance of phosphorylated to total AMPK. CT, control; LP, low‐protein diet. The bar represents the mean ± SEM expressed as relative abundance of protein standardized against Actb (n = 4) or the ratio of abundance of phosphorylated to total AMPK. *P < 0.05; **P < 0.01.
