
Figure 4.
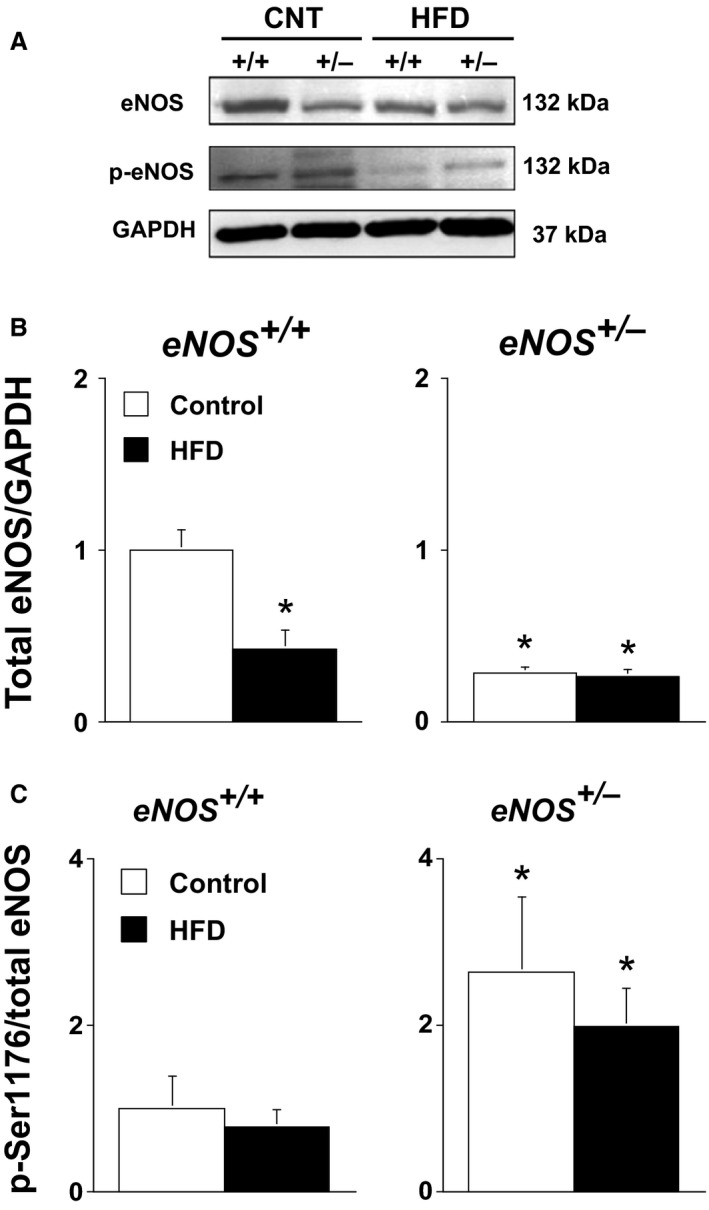
(A) Western blot for total eNOS expression and phosphorylated Ser1176 eNOS levels in aorta form eNOS +/+ and eNOS +/− fed either a control or HFD. (B) Quantification of total eNOS expression, and (C) phosphorylated Ser1176 eNOS levels. Values are Means ± SE; n = 5/group; *P < 0.05 versus eNOS +/+.