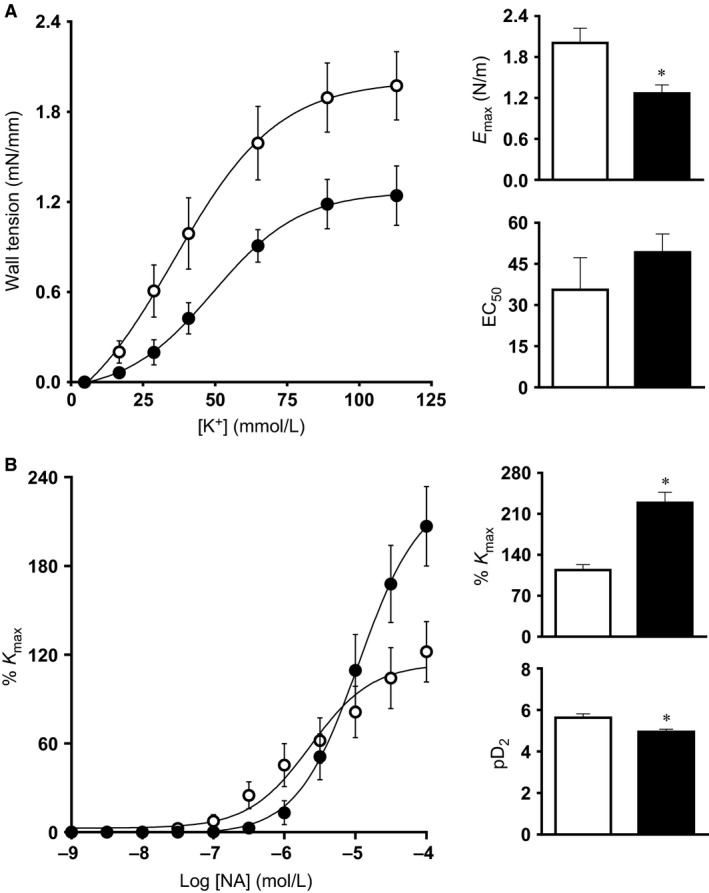
Figure 6.

Fetal peripheral vasoconstrictor function. Values are mean ± SEM for the concentration–response curves, the maximal constriction (E max or %K max), and the sensitivity (EC50 or pD2) to potassium (K+; A) and to noradrenaline (NA; B). Groups are normoxia (N, ○, n = 10) and hypoxia (H, ●, n = 8). Significant (P < 0.05) differences are: * versus normoxia, Student's t‐test for unpaired data.
