Figure 2.

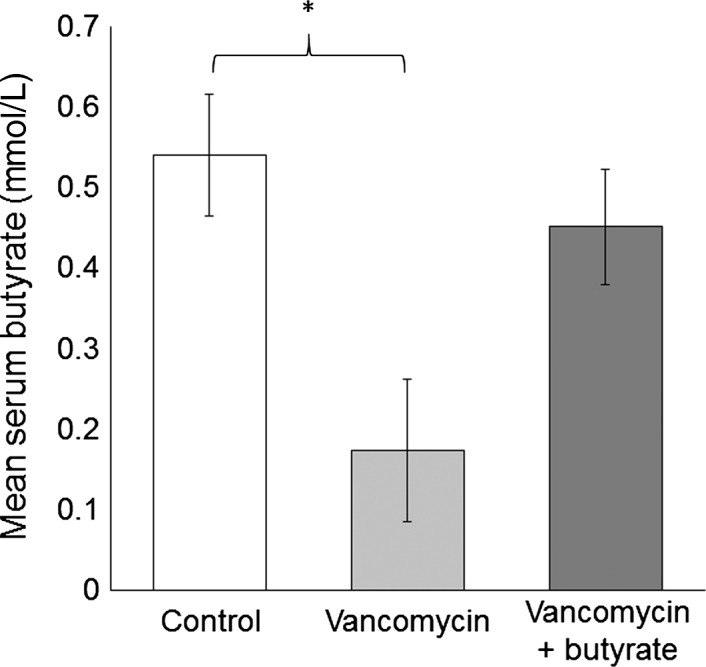
Serum butyrate concentration in each treatment group, expressed as mean ± SEM. Serum was collected by cardiac puncture at the time of sacrifice. *P < 0.05 relative to control group.

Serum butyrate concentration in each treatment group, expressed as mean ± SEM. Serum was collected by cardiac puncture at the time of sacrifice. *P < 0.05 relative to control group.