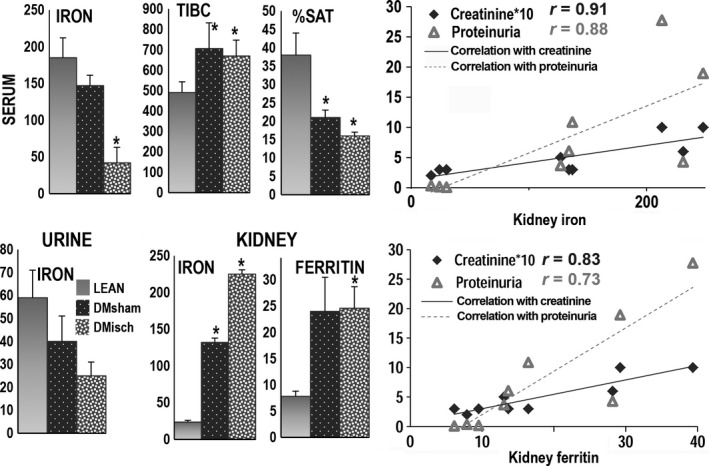
Figure 3.

Iron levels in blood, urine and kidney. The left panels show that serum iron levels (μg/100 mL) were lower in obese/diabetic ischemic rats, n = 11 (speckled, DMisch, DI; P < 0.002) and in obese diabetic sham‐operated rats, n = 7 (black/white dots, DMsham, or DS; P < 0.002) than in lean sham‐operated rats, n = 6 (gray, LEAN or LS). The clinical laboratory parameter total iron binding capacity (TIBC, μg/100 mL), a surrogate measurement of transferrin, was higher in DMsham (P = 0.04) and DMisch (P < 0.004) than in LEAN. Hence, the percent saturation of serum TIBC (% SAT) by iron was lower in DMsham and DMisch rats (P < 0.002 for both) than in LEAN rats. Urine iron levels (μg/24 h) were also lower in obese/diabetic ischemic rats (DMisch; P < 0.05) and obese/diabetic sham‐operated rats (DMsham) (NS) than in sham‐operated normal rats (LEAN). Levels of renal iron deposits (pixels of renal ferric ferrocyanide × 200 high power filed) were higher in DMisch (P = 2.9 × 10⁻⁶) and DMsham (P = 0.0005) than in LEAN rats. Renal heavy‐chain ferritin levels measured by Western blot were higher in DMisch (P < 0.05) and higher in DMsham (NS) than in LEAN. The ferritin heavy chain data were normalized to the corresponding actin band. The right panels show a positive correlation for serum creatinine levels (mg/100 × 10) and urine protein mg/mg creatinine with renal iron deposits (Top) and a positive correlation among serum creatinine and urine protein with renal ferritin levels (Bottom).
