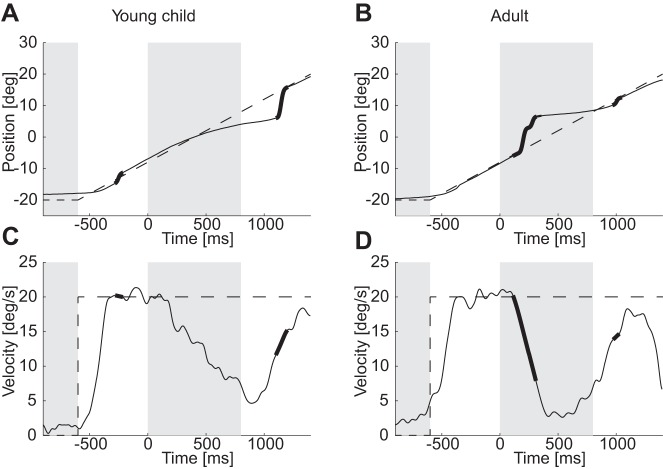
Fig. 2.
Typical trials. A and B: position of the eye during typical test trials from a young child and an adult. C and D: the corresponding desaccaded eye velocities. Bold parts of lines represent saccades on the position graphs and the timing of saccades on desaccaded eye-velocity graphs. Dashed lines represent, respectively, the target displacement or velocity.

