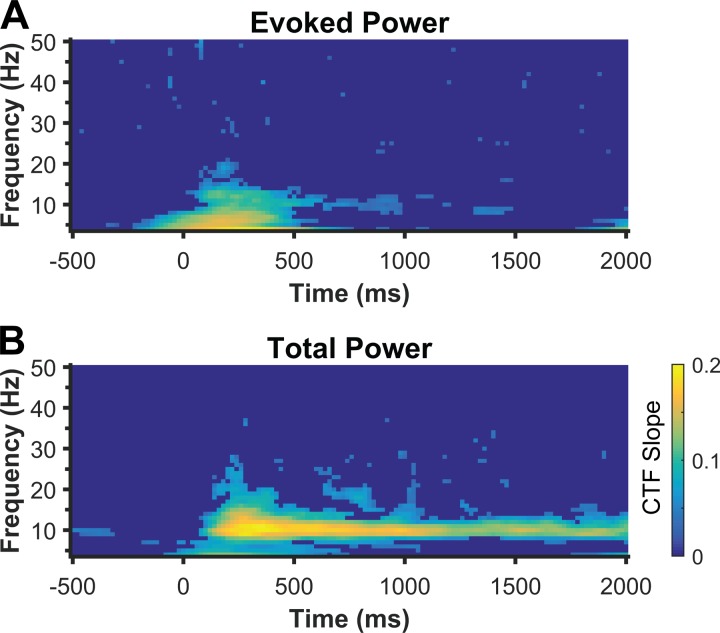
Fig. 2.
Identifying the frequency bands that track the content of spatial WM in experiment 1. An IEM was used to reconstruct location-selective channel tuning functions (CTFs) from the topographic distribution of evoked (A) or total (B) power across a broad range of frequencies (4–50 Hz, in increments of 1 Hz) and time. Evoked and total power transiently tracked stimulus location after stimulus onset across a broad range of frequencies (4 to ∼20 Hz). However, only total alpha power tracked the content of spatial WM throughout the delay period. Color represents CTF slope, a measure of CTF selectivity that quantifies the location-specific activity in the topographic distribution of power. Points at which CTFs slope was not reliably above zero as determined by a permutation test are set to zero (dark blue).

