Fig. 8.
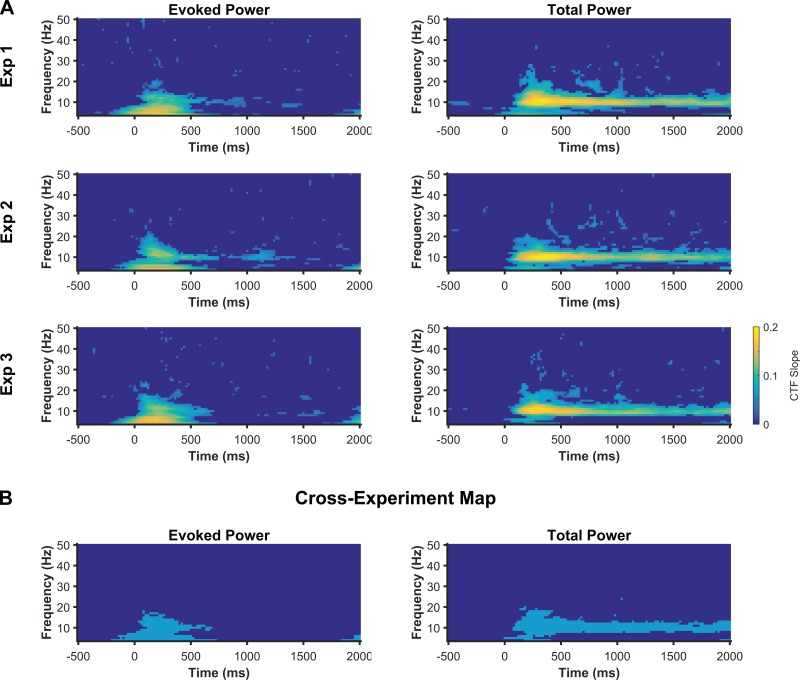
Location-selective activity is specific to the alpha band. A: slope of CTFs reconstructed from the topographic distribution of evoked and total power across a broad range of frequencies (4–50 Hz, in increments of 1 Hz) and time for experiments 1–3. Points at which CTF slope was not reliably above zero as determined by a permutation test are set to zero (dark blue). B: cross-experiment map of the points for which CTF slope was reliably above chance for all three experiments. Reliable points are shown in light blue. Across three experiments, evoked and total power transiently tracked stimulus location after stimulus onset across a broad range of frequencies (4 to ∼20 Hz) while only total alpha power tracked the content of spatial WM throughout the delay period.

