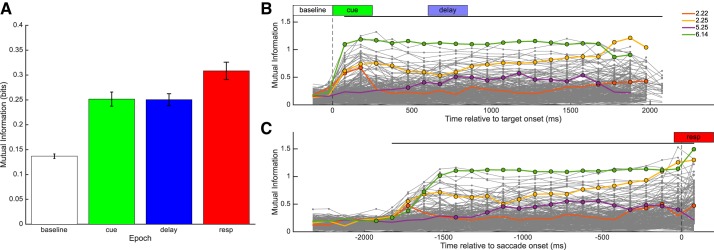
Fig. 5.
Mutual information (MI) between each neuron's firing rate and target location. A: average mutual information ± SE across neurons for each analysis epoch. Mutual information was significantly different between each pair of analysis epochs. Mutual information time-series relative to target onset and relative to saccade onset are presented in B and C, respectively. Time windows used for analysis epochs baseline, cue, delay, and response (resp) are indicated in white, green, blue, and red, respectively. Data points with a circle indicate time points for individual neurons for which MI was significantly different from baseline. The black bars above the individual traces indicate time points over which the population MI was significantly different from baseline. Traces from the 4 individual neurons presented in Fig. 3 are highlighted.

