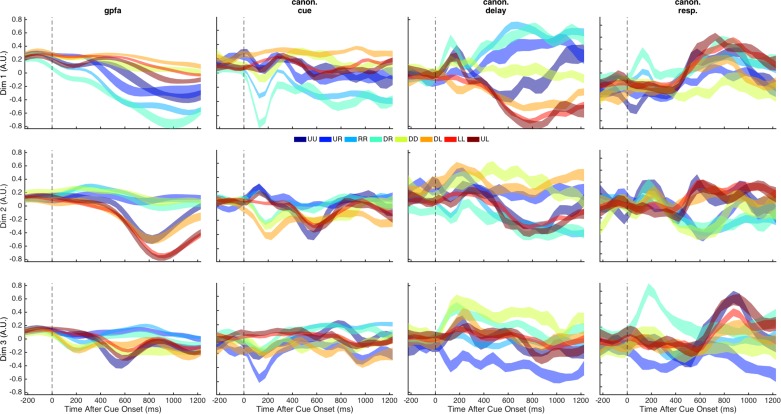
Fig. 6.
Neural activity projected into the top 3 dimensions for different trajectories. Each column corresponds to a different neural trajectory (gpfa, Gaussian process factor analysis; canon. cue, canonical trajectories with component weightings calculated using cue epoch activity only; canon. delay, canonical trajectories based on delay epoch activity; canon. resp., canonical trajectories based on response epoch activity). Each row corresponds to a different dimension of the neural trajectory, ordered by decreasing variance. Each trace corresponds to the mean ± SE trajectory values (A.U., arbitrary units) of trials grouped by target location for a given trajectory and dimension. The different colors indicate the different target locations (UU: up-center; UR: up-right; RR: middle-right; DR: down-right; DD: down-center; DL: down-left; LL: middle-left; UL: up-left). The vertical dashed line indicates the time of cue onset.

