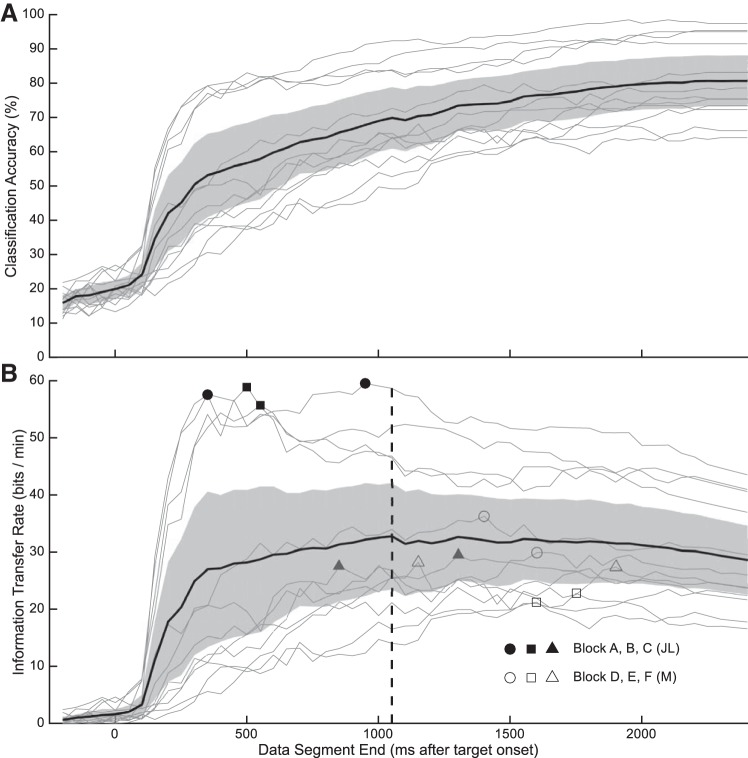
Fig. 9.
Classification accuracy (A) and information transfer rate (ITR) (B) as a function of neural trajectory length. Individual sessions are plotted with thin lines, the average across sessions is plotted with the thick black line, and the gray shaded region is the 95% confidence interval. Symbols indicate the peak ITR for each session and the vertical dashed line indicates the trajectory duration that yielded the optimal ITR averaged across sessions.

