
Fig. 10.
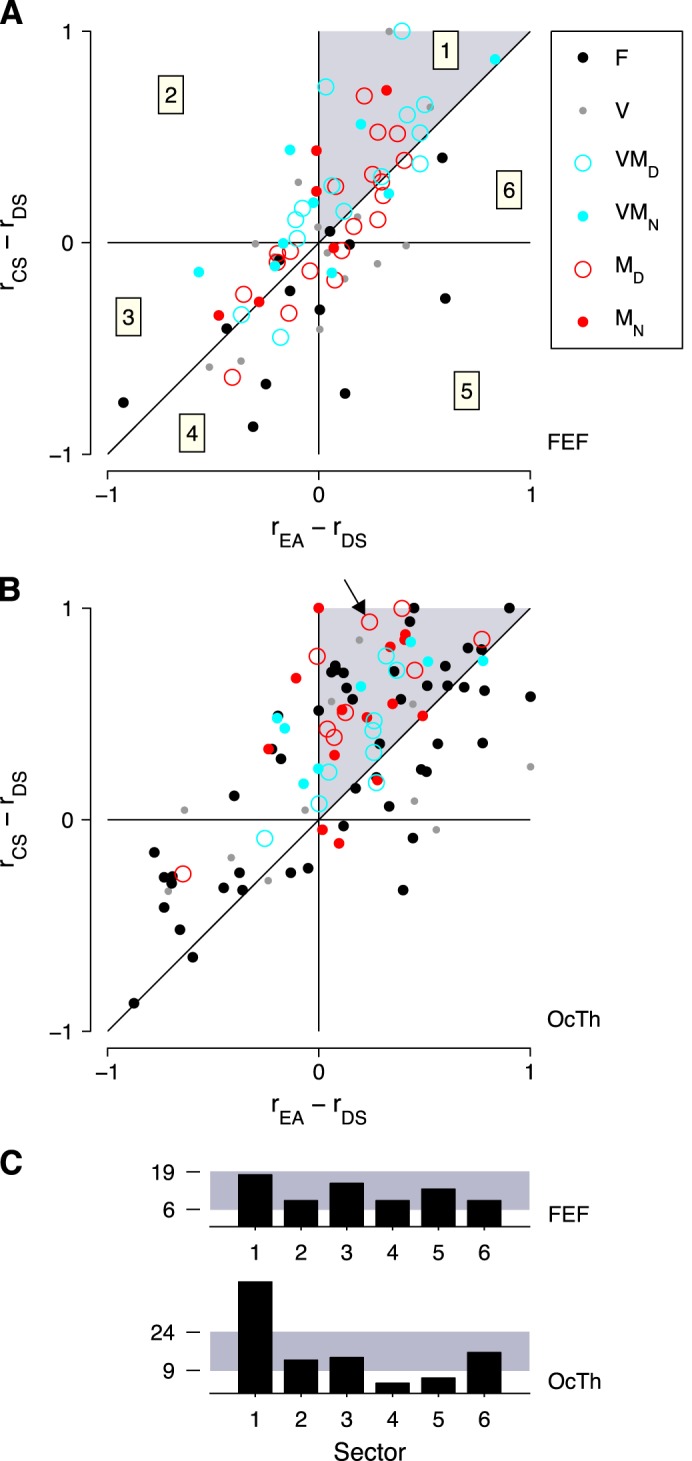
Preferred task order in FEF and OcTh. For each neuron recorded in the three tasks, differences in presaccadic responses across tasks were generated. The x-axes show the modulation between the easy choice (EA) and DS tasks, and the y-axes show the modulation between the CS and delayed saccade tasks. Responses are for correct movements into the RF only, and normalized for a maximum modulaton of ±1 (see materials and methods). A: task modulation in FEF. Each point corresponds to one neuron (n = 73). Numbers inside squares indicate the 6 sectors of the plot. Each sector corresponds to one of six possible task preference patterns. For sector 1 (gray shade), the preferred order is rCS > rEA > rDS. B: as in A, but for OcTh neurons (n = 97). Arrow points to the neuron in Fig. 5C. C: total number of neurons in each sector, for the data in A (FEF, top) and B (OcTh, bottom). Gray shade indicates the 95% confidence interval around the expected number of points per sector assuming no bias. Upper and lower limits are indicated in each case.