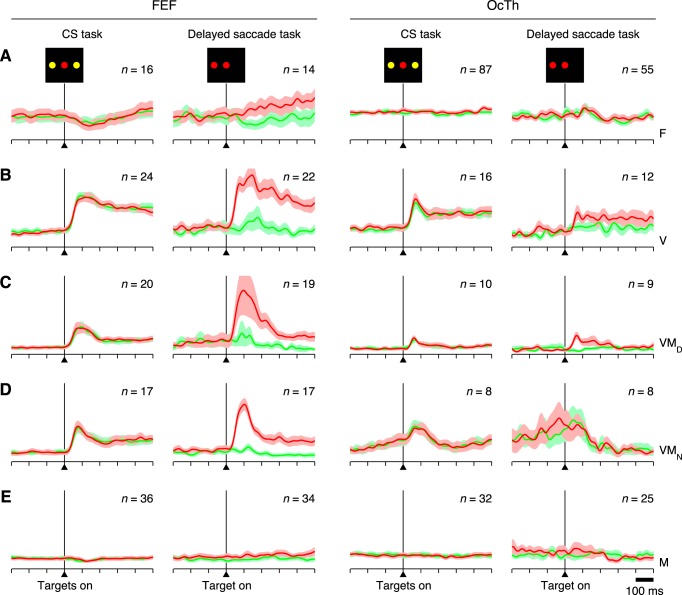
Fig. 11.
Visual transient activity across tasks, in FEF and OcTh. All traces correspond to normalized firing rate as a function of time for correct responses into (red) or away from (green) the RF, averaged across all neurons participating in each condition (n, indicated in each plot). Shaded areas indicate ±1 SE across neurons. Data are aligned on the onset of the choice targets (CS task) or on the onset of the single saccadic target (delayed saccade task). Columns correspond to different tasks and areas, as marked at top. A–E: responses for 5 neuron types, F (A), V (B), VMD (C), VMN (D), and M (E) as indicated at right.

