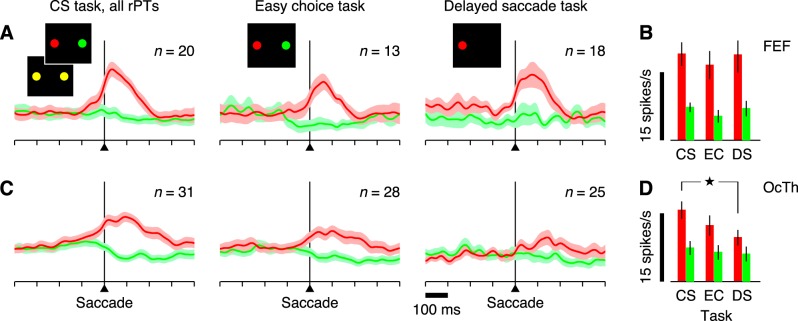
Fig. 12.
Postsaccadic activity across tasks, in FEF and OcTh. A: all traces correspond to normalized firing rate as a function of time for correct responses into (red) or away from (green) the RF. Results are averages across all FEF neurons selected as postsaccadic (see main text) in each condition (n, indicated in each plot). Shaded areas indicate ±1 SE across neurons. All data are aligned on saccade onset. Columns correspond to the three tasks, as marked at top. B: firing rate magnitudes (in spikes/s) for the 3 tasks shown in A, CS, EC, and DS. Each bar represents the mean rate computed in the 200 ms following saccade onset and averaged over all postsaccadic neurons, with error bars indicating ±1 SE across neurons. Red and green are for choices into (red) and away from (green) the RF, respectively. C: as in A, but from OcTh recordings. D: as in B, but from OcTh recordings. ⋆P = 0.0003, significant difference.

