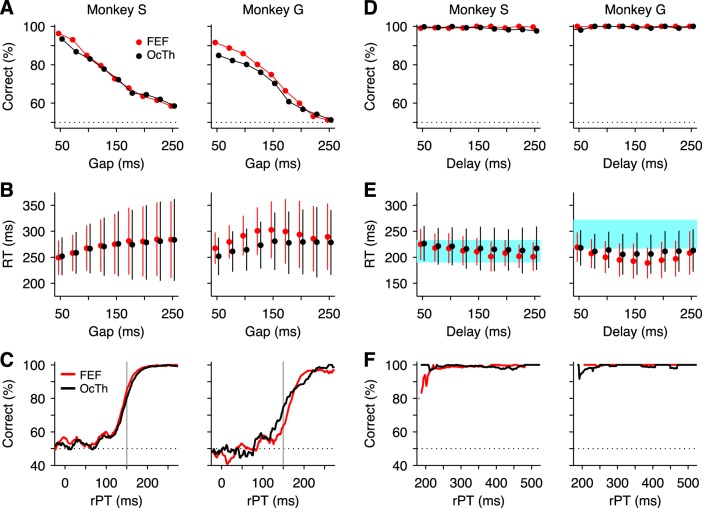
Fig. 4.
Psychophysical performance in color discrimination with and without an urgency requirement. A: psychometric curve in the CS task: percentage of correct responses as a function of gap. B: chronometric curve in the CS task: mean RT (±1 SD) as a function of gap. Both correct and incorrect responses are included. C: tachometric curve in the CS task: percentage of correct responses as a function of rPT (equal to RT − gap). Gray vertical lines mark rPT = 150 ms, used to separate guesses from informed choices. D: psychometric curve in the easy choice task: percentage of correct responses as a function of delay. E: chronometric curve in the easy choice task: mean RT (±1 SD) as a function of delay. For comparison, blue shades indicate the mean RT (±1 SD) from all trials of the delayed saccade task (FEF and OcTh sessions combined) for each monkey. F: tachometric curve in the easy choice task: percentage of correct responses as a function of rPT (equal to RT + delay). In A–F, red and black lines and data points correspond to behavior during the FEF and OcTh recording sessions, respectively. See Table 1 for numbers of trials in each condition.

