
Fig. 5.
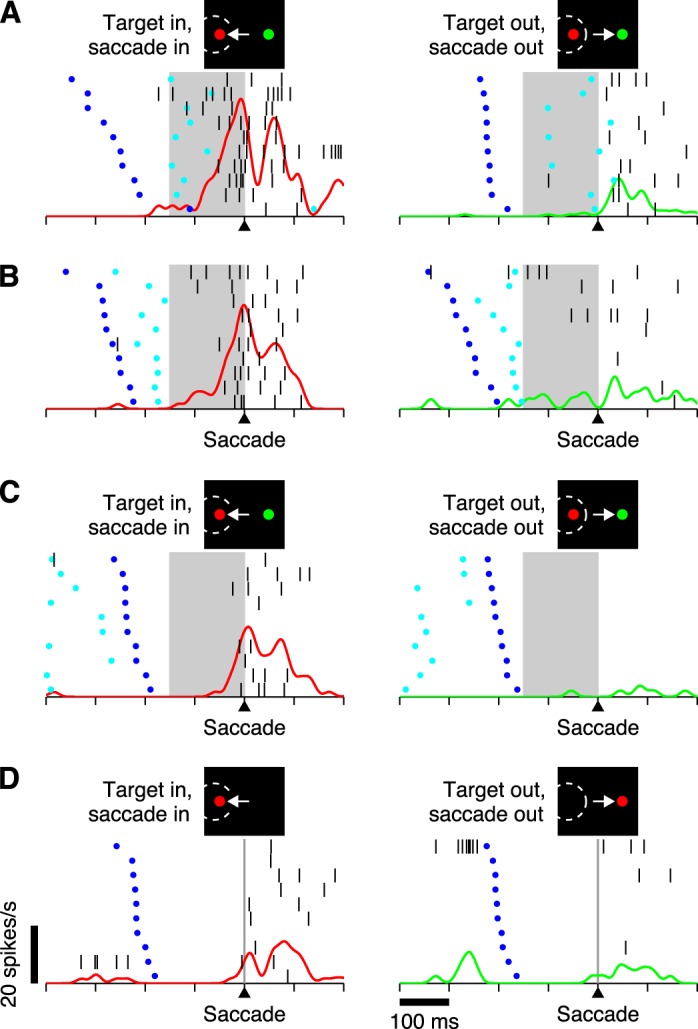
Responses of a single neuron recorded from OcTh in the 3 tasks. All trials correspond to correct saccadic choices, either into (left column) or away from (right column) the RF of the cell. Different panels are for different experimental conditions. Each panel shows instantaneous firing rate as a function of time (red/green continuous traces) superimposed on a corresponding spike raster. Each raster plot consists of 10 randomly selected trials (rows) sorted by RT, from long (top) to short (bottom). Each trial in a raster indicates when the go signal (dark blue dots), the cue (light blue dots; for choice tasks only), and individual action potentials (vertical black lines) occurred. All data are aligned with respect to saccade onset (triangles on time axis). A: responses in short-rPT trials (rPT < 150 ms) of the CS task, which correspond to guesses. B: responses in long-rPT trials (rPT ≥ 150 ms) of the CS task, which correspond to informed choices. C: responses in the easy choice task. D: responses in the delayed saccade task. Shaded areas mark the critical 150-ms interval that precedes the saccade in the choice tasks. Scale bars in D for time axis and firing rate traces apply to all plots. This neuron was classified as MD.