
Fig. 8.
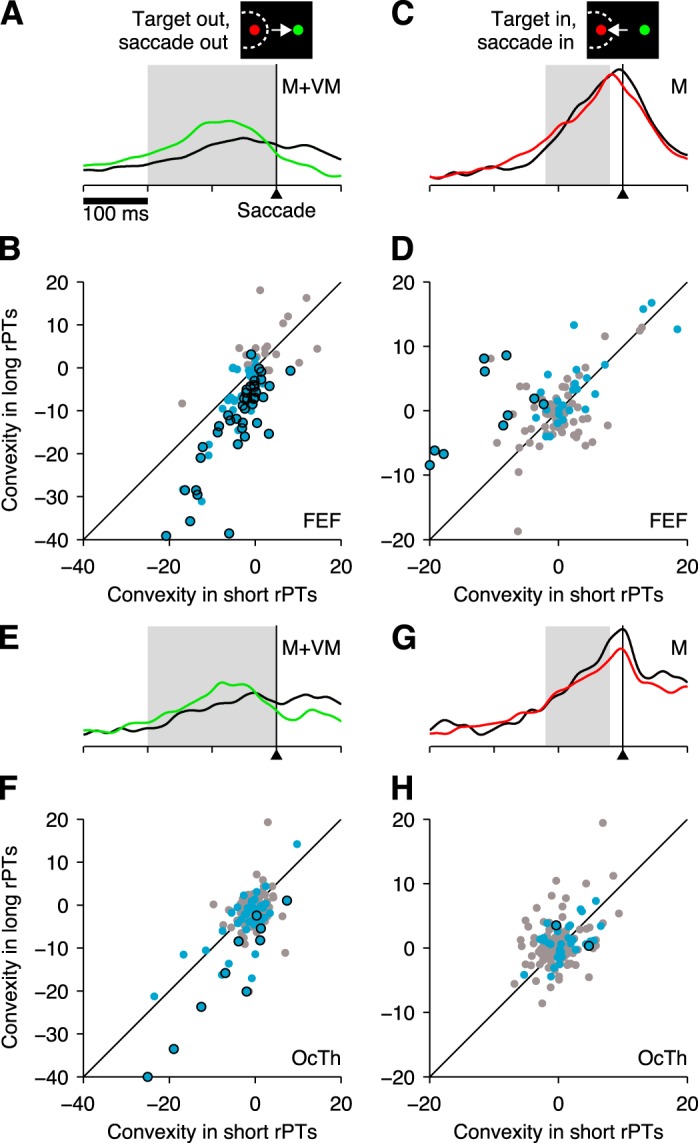
Impact of perceptual information quantified by convexity. A: normalized firing rate as a function of time for all M and VM neurons in FEF combined, for correct choices away from the RF. The 2 traces are for short- (black) and long-rPT (green) trials. Gray shade indicates 200 ms window used for measuring convexity in this condition. B: convexity values in long (y-axis)- vs. short-rPT trials (x-axis) for choices away from the RF. Each point corresponds to one FEF neuron, either with a motor response (M and VM types; blue dots) or without (F and V types; gray dots). Individually significant neurons (P < 0.05) in the former group are indicated by black outlines. The diagonal line marks equality across conditions. Convexity units are spikes/s. C: normalized firing rate as a function of time for all M neurons in FEF, for correct choices into the RF. The 2 traces are for short- (black) and long-rPT (red) trials. Gray shade indicates a 100-ms window used for measuring convexity in this condition. D: convexity values in long (y-axis)- vs. short-rPT trials (x-axis) for choices into the RF. Points correspond to FEF neurons of type M (blue dots) or of a different type (VM, F, or V; gray dots). Individually significant neurons (P < 0.05) in the former group are indicated by black outlines. For clarity, one outlier neuron with a highly negative value along the x-axis was placed exactly on the y-axis. E–H, As in A–D but for OcTh neurons. In F, for clarity, 1 outlier neuron with a highly negative value along the y-axis was placed exactly on the x-axis.