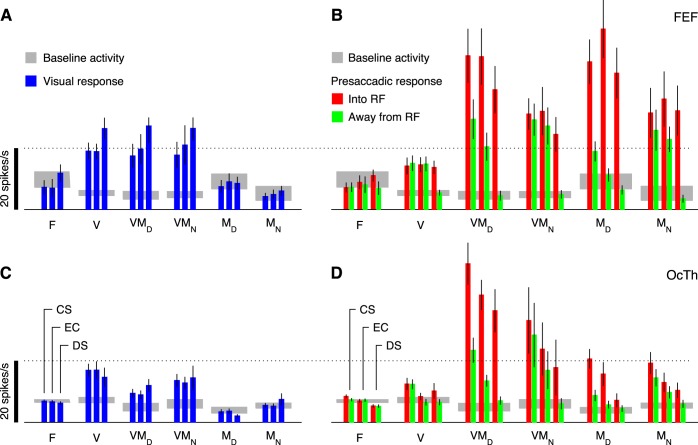
Fig. 9.
Firing rate magnitudes (in spikes/s) compared across tasks and neuronal types. Each colored bar shows the mean firing rate computed in a given time window (see materials and methods) and averaged over all neurons of the same class (labeled on the x-axis), with error bars indicating ±1 SE across neurons. Gray shades show the mean baseline activity ±1 SE computed before targets on. A: visual responses of FEF neurons following targets on. Each bar triplet indicates results from the CS task (all rPTs), the easy choice task (EC), and the delayed saccade task (DS), as labeled at bottom. B: responses of FEF neurons before movement onset. Red and green bars are for saccades into and away from the RF, respectively. Each bar triplet of the same color indicates results from the CS, EC, and DS task, as labeled at bottom. C: as in A, but from OcTh recordings. D: as in B, but from OcTh recordings.

