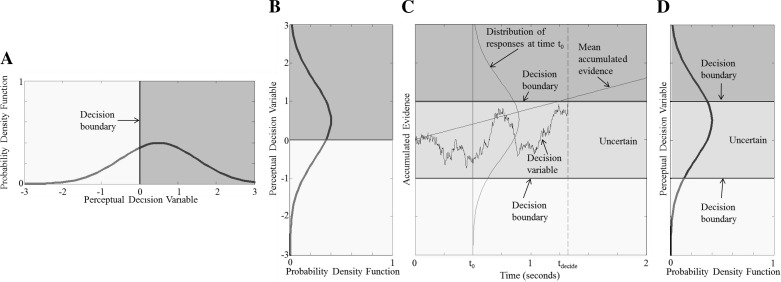
Fig. 1.
Decision-making models applied to perceptual motion direction-recognition tasks. We emphasize that the models shown all apply to tasks whereby subjects are asked to classify the direction of motion (e.g., left vs. right), which is a type of motion direction discrimination sometimes referred to as direction recognition. A: for untimed forced-choice tasks, the signal detection model assumes that a physical stimulus is contaminated with noise to yield a perceptual decision variable distribution. One sample from this distribution for each trial yields the decision variable for that trial. If the sampled decision variable for a given trial falls to the left of the decision boundary, “left” is reported. If the decision variable falls to the right of the decision boundary, “right” is reported. B: to allow a direct comparison with C and D, we rotate the same decision variable and signal detection model from A by simply swapping the abscissa and ordinate. C: for response-time tasks, a drift-diffusion model is often used to help model the time dependencies of the data. A time plot for a drift-diffusion model shows a decision variable for a single trial plotted against time. When the decision variable crosses a decision boundary, a decision is made: “left” for top decision boundary and “right” for bottom decision boundary. The time of the decision is indicated as tdecide. Before the decision variable crosses a decision boundary, the subject is undecided. The distribution of the decision variables across many trials at time 0 (t0) is also shown. The average evidence accumulation corresponds to the physical stimulus and in this example is assumed to be constant over time. D: a signal detection model that includes uncertainty as one of the options provides a simple extension to the signal detection model shown in A and B. Here the same decision variable is sampled but with 2 decision boundaries. If the sampled decision variable falls to the left of the most leftward decision boundary, “left” is reported. If the sampled decision variable falls to the right of the most rightward decision boundary, “right” is reported. If the sampled decision variable falls between the 2 decision boundaries, “uncertain” is reported. Note the intentional similarity of the probability distribution at t0 in C and the probability distribution in D.

