Fig. 2.
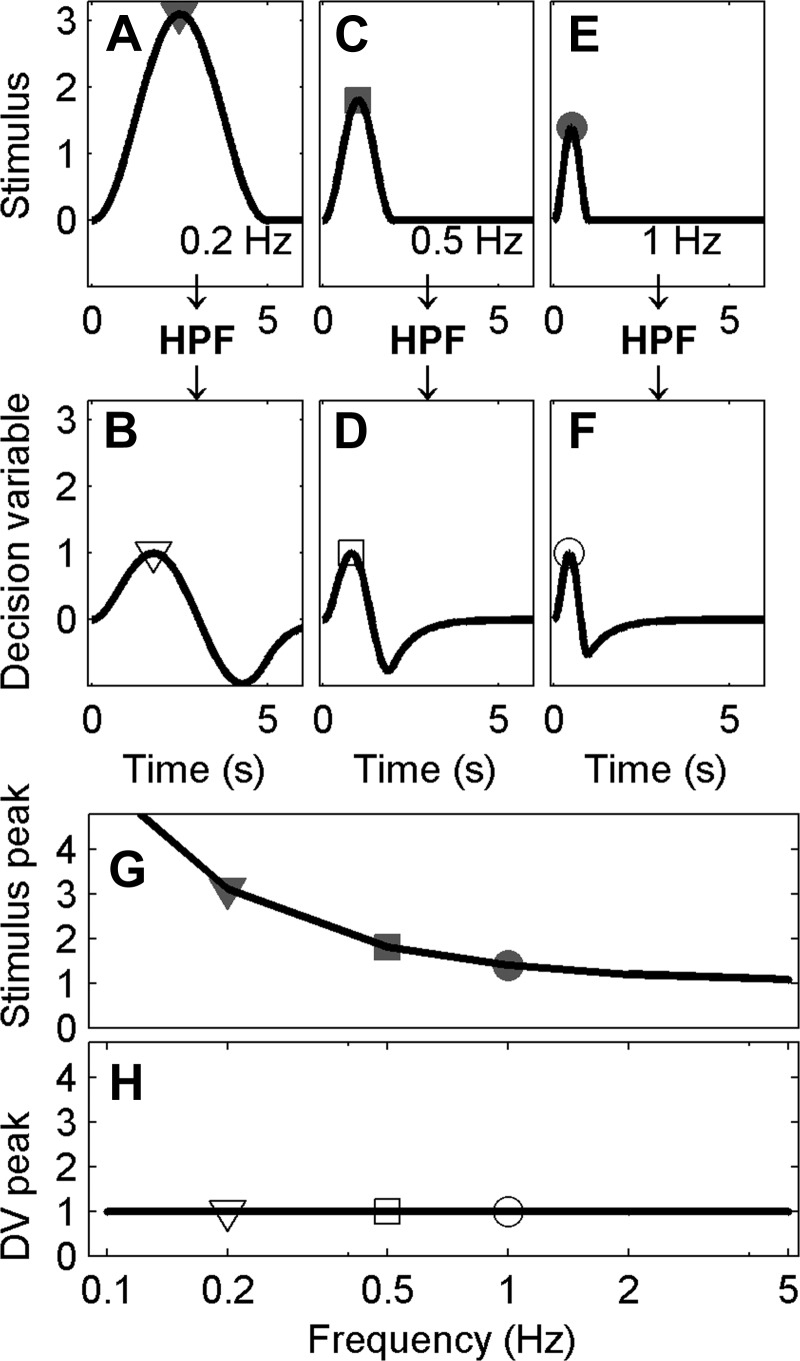
The high-pass filter (HPF) hypothesis predicts that thresholds increase at low frequencies. A: a typical cosine bell physical stimulus with a frequency of 0.2 Hz, corresponding to a period of 5 s, with the peak signal indicated by the gray filled triangle. B: high-pass filtered version of the 0.2-Hz signal, which yields the hypothesized decision variable, with the peak signal indicated by the open triangle. Similarly, 0.5- and 1-Hz signals are shown before (C, E) and after HPF (D, F). For illustration purposes, stimulus amplitudes have been selected so that the decision variable always has a peak of 1. This requires lower frequency stimuli to have larger amplitudes to yield the same peak decision variable after filtering. G: stimuli peak at a range of frequencies, with gray filled symbols indicating the peak for the examples shown by corresponding symbols in A, C, and E. H: the peak decision variable (DV) across a range of frequencies, with the open symbols representing the peaks shown by corresponding symbols in B, D, and F. High-frequency signals are relatively unaffected by an HPF; low-frequency signals are attenuated. Thus larger signals are required at low frequencies to yield the same signal amplitude after a high-pass filter compared with high frequencies.

