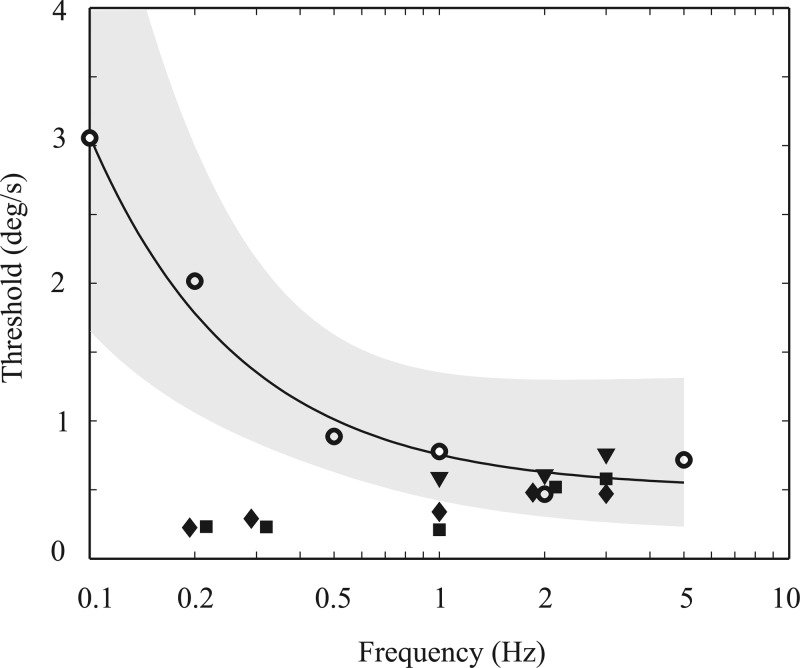
Fig. 4.
Comparison of monkey vestibulo-ocular reflex (VOR) thresholds and human perceptual thresholds as a function of frequency. Open symbols show the average human perceptual thresholds from Grabherr et al. (2008) converted to “one-sigma” thresholds. Note the plateau in human perceptual thresholds for frequencies above 1 Hz and substantive threshold increase as frequency decreases below 1 Hz. The solid curve shows the least-square fit to the human threshold data, with the shaded area indicating 1 SD from the mean. Filled symbols show the VOR thresholds for each of 3 monkeys. [Modified from Haburcakova et al. (2012), where details can be found.]

