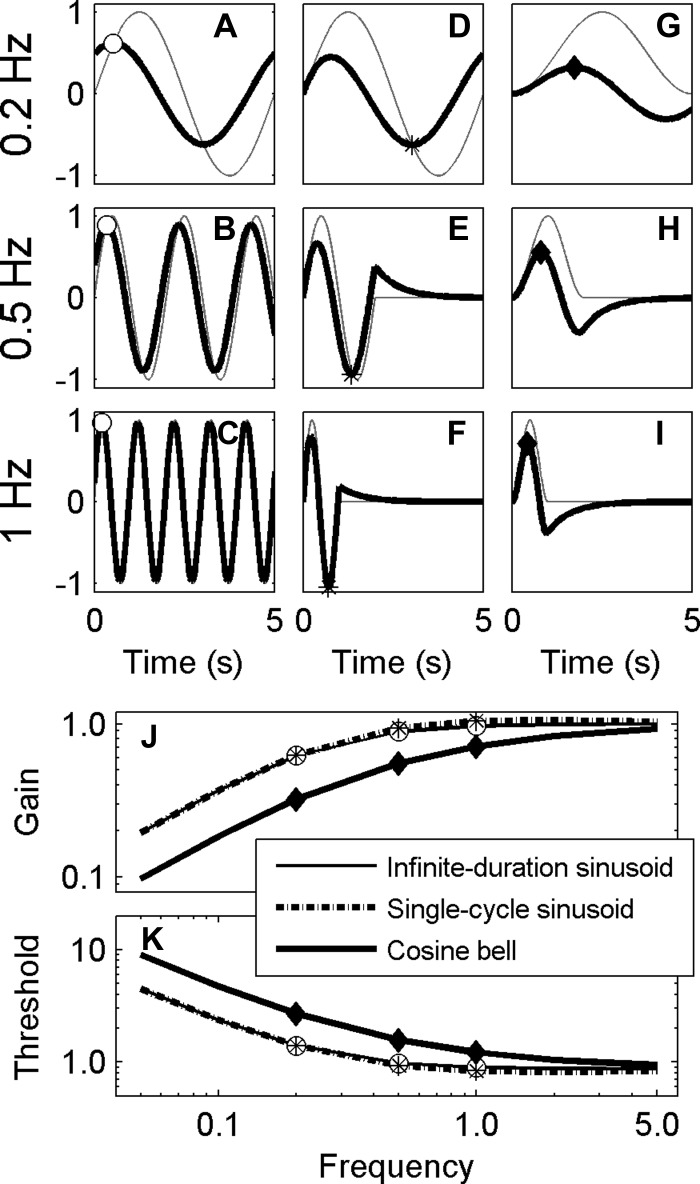
Fig. A2.
A: a portion of a 0.2-Hz infinite-duration sinusoid (thin gray line) and the steady-state response after application of an HPF (thick black line) with a cutoff of 0.25 Hz, corresponding to a time constant of 0.6 s. Peak output magnitude is indicated with an open circle. B and C: the same as A for 0.5 and 1 Hz, respectively. D–F: single-cycle sinusoids (thin gray line) and the result of high-pass filtering (thick black line), with peak output magnitude indicated with an asterisk. G–I: cosine bells (thin gray line), which are the integral of single-cycle sinusoids, and the result of high-pass filtering (thick black line), with peak output magnitude indicated with a filled diamond. J: gain, measured as the ratio of peak output magnitude to peak input magnitude, for infinite-duration sinusoids, single-cycle sinusoids, and cosine bells. K: the corresponding threshold for the gains shown in J.

