
Fig. 10.
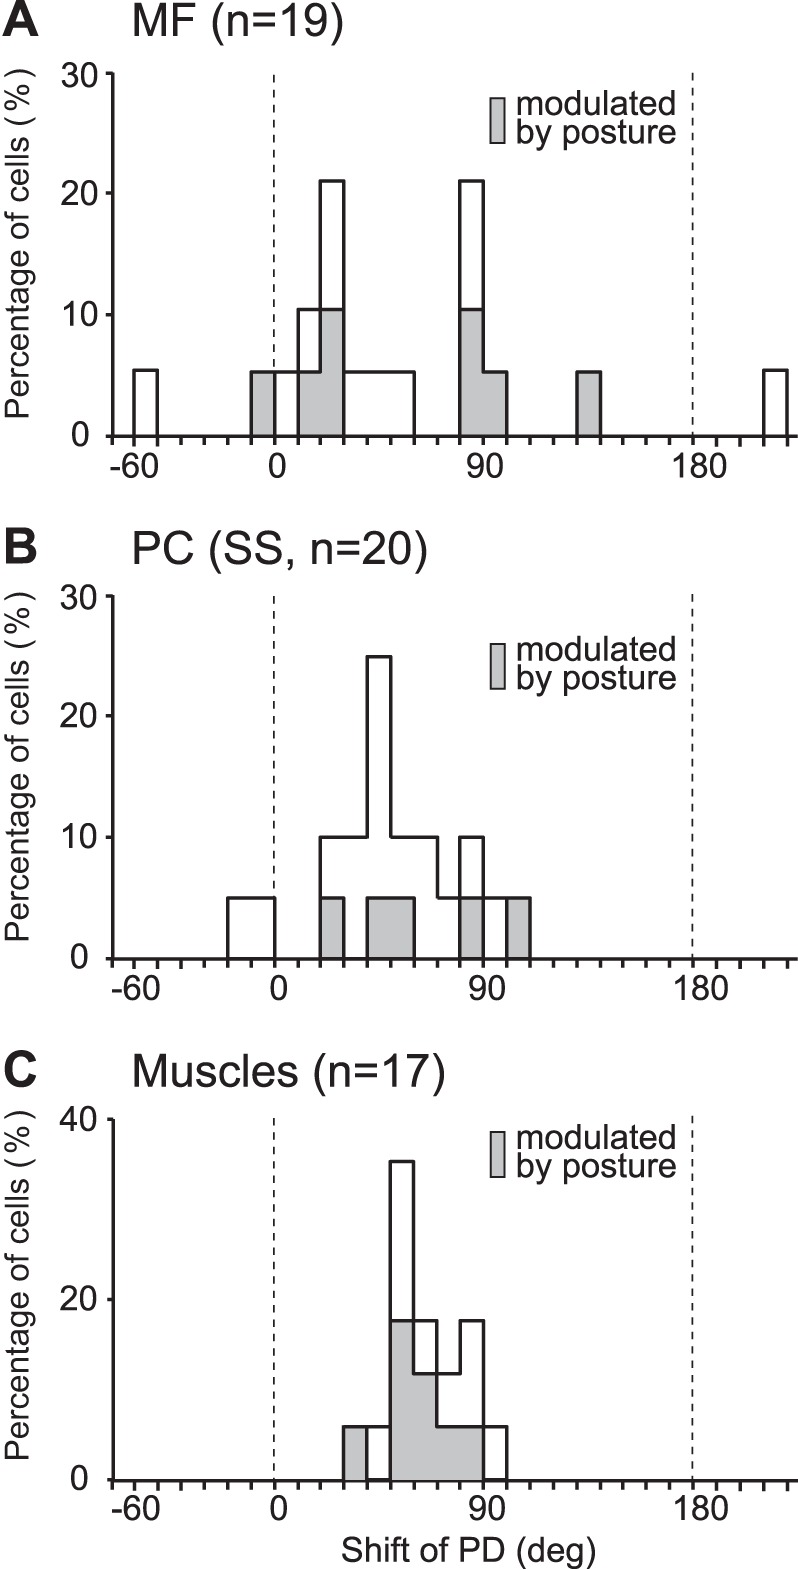
Distribution of shifts in PD from PRO to SUP for MFs (A), PCs (B), and task-related muscles (C) in a time window of −25 to 0 ms relative to movement onset. Shaded bars represent neurons or EMGs showing “gain modulation” (i.e., a change in the maximum of mean activity of >30% with a change of forearm posture). Bin width = 10°. Note that 180° is the same as −180°.