Fig. 12.
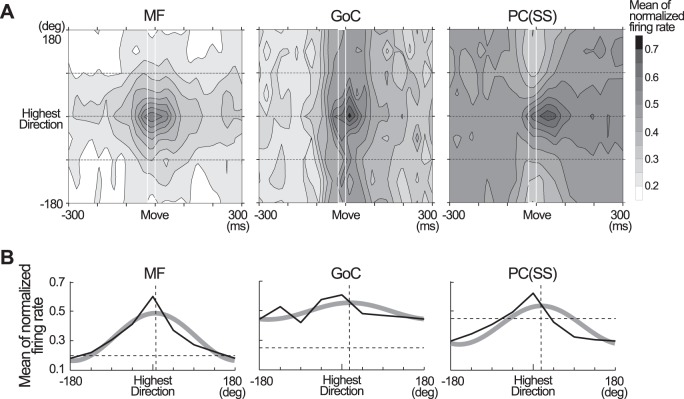
Comparison of normalized, directionally aligned activities of 3 neuron types. A: contour plots of mean normalized activity for each type of neuron; n = 54 MFs, 25 GoCs, 42 PCs (SS). White rectangles indicate the 25-ms time window immediately before movement onset. B: directional modulation in the 25-ms time window highlighted by the white rectangles in A. Thin black lines show the mean values of the normalized firing rate in each of the 8 movement directions. Thick gray lines show the best fit cosine, calculated as in Kakei et al. (1999). Vertical dashed lines indicate the PD of each cosine curve, plotted relative to the direction of highest activity. PD was shifted by 5.2° in MFs, 7.8° in GoCs, 8.0° in PCs (SS). Horizontal dashed lines indicate the mean normalized firing rate in the first time bin (−300 to −275 ms relative to Move) of all 8 directions as a baseline. Baseline was at 0.20 (SD 0.03) for MFs, 0.25 (SD 0.03) for GoCs, 0.46 (SD 0.02) for PCs (SS). All figures were made using data in PRO, but we obtained nearly the same results in SUP (not shown).

