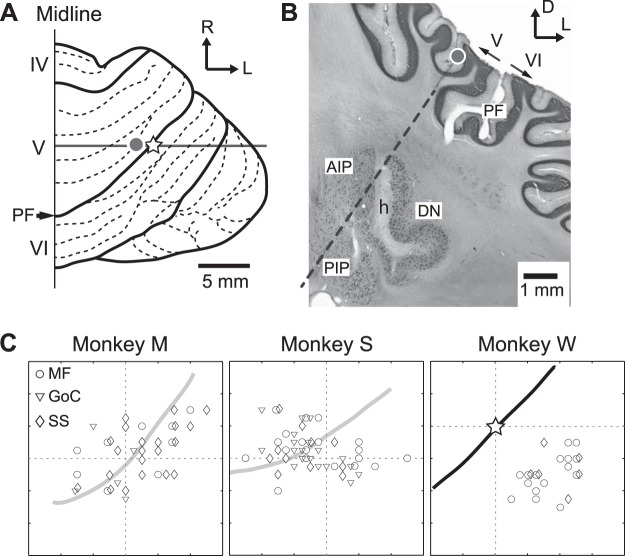
Fig. 5.
Distribution of task-related MFs, GoCs, and PCs in the cerebellar cortex. A: dorsal view of the right cerebellar hemisphere of monkey W. The open star indicates the center of the recording chamber. The gray dot indicates the location of a PC that was identified by the electrolytic lesion shown in B. PF, primary fissure; IV-VI, lobules IV-VI; R, rostral; L, lateral. B: coronal section of the cerebellum of monkey W at the level of the transverse gray line with the gray dot in A. The gray dots in A and B indicate the location of an electrolytic lesion marking a PC. The dashed line indicates a recording track. AIP, anterior interpositus nucleus; PIP, posterior interpositus nucleus; h, hilum; D, dorsal. C: distribution of task-related MFs, GoCs, and PCs for the 3 animals. Open circles indicate track locations of recorded MFs, inverse rectangles indicate track locations of recorded GoCs, and open diamonds indicate track locations of recorded PCs. For monkey W, the location of the PF (indicated by the black line) was confirmed with histology. For monkeys M and S, the gray lines indicate estimated locations of the PF. The intersection of the 2 dashed lines indicates the center of the recording chamber in each animal.

