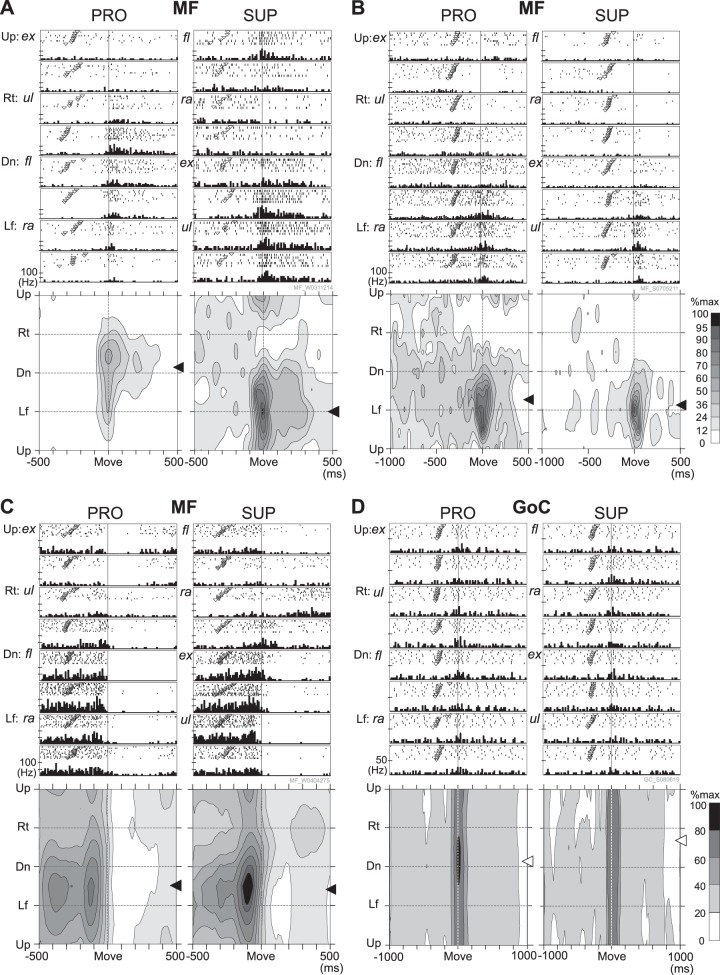
Fig. 6.
Raster plots, histograms, and contour plots of typical examples of activity of 3 sample MFs (A–C) and 1 GoC (D) in 2 postures (PRO and SUP). The abscissae represent time (in ms) relative to movement onset (Move). The ordinates represent movement direction. In PRO, Up, Rt, Dn, and Lf correspond to ex, ul, fl, and ra, respectively. In SUP, Up, Rt, Dn, and Lf correspond to fl, ra, ex, and ul, respectively (see also Fig. 4A). Inverted open triangles in the rasters indicate the timing of the “GO” cue in each trial. Bin width of histograms is 10 ms for MFs and 20 ms for the GoC. Each tick mark on the ordinate of the histograms represents 50 Hz; thus 2 ticks represent 100 Hz. The contour plots show the same data as that in the histograms presented here. The scale of each contour plot is normalized to the maximum firing rate of each neuron (= 100%) during the task period. The scale for activity of the GoC is coarser than that for MFs and PCs attributable to the much lower maximum firing rates of GoCs (<30 Hz). The arrows beside each contour plot indicate the PD in a time window that includes neural activity related to movement onset (A, B, D = −100 to 100 ms relative to movement onset; C = −200 to 0 ms relative to movement onset). Black arrows indicate statistically significant PDs, and white arrows indicate nonsignificant PDs defined by a bootstrapping method (see materials and methods). Respective PDs with statistical significance: A: −181.8° PRO, −98.4° SUP; B: −160.4° PRO, −178.5° SUP; C: −139.3° PRO, −144.4° SUP. Here, 0° represents the rightward direction. A positive value indicates an upward bias, and a negative value indicates a downward bias.

