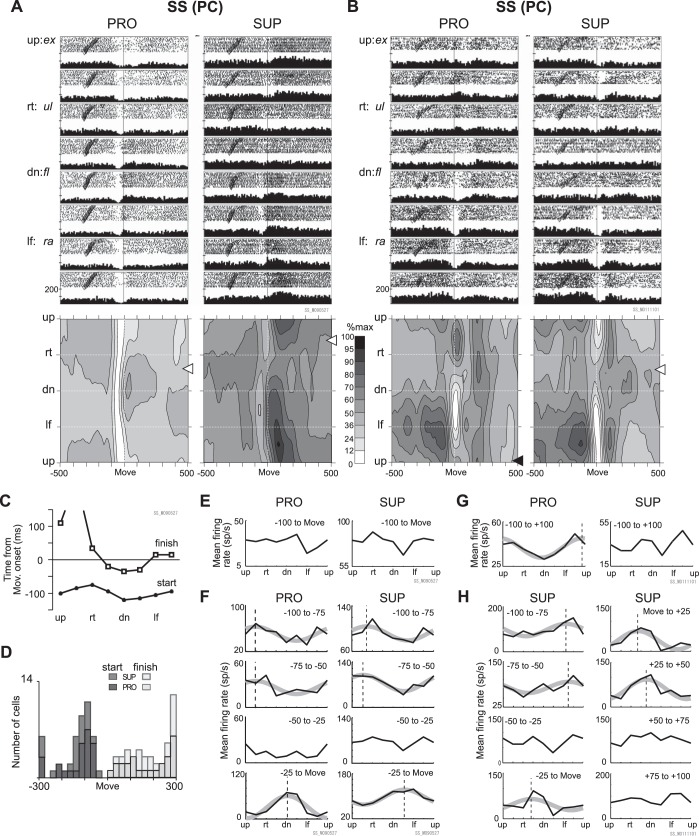
Fig. 7.
A total of 2 samples of SS activity of PCs. A and B: raster plots, histograms, and contour plots of typical examples of activity of PCs in 2 postures (PRO and SUP). The same format is used as for MFs in Fig. 6. Inverted filled triangles above histograms indicate significant suppression compared with spontaneous activity. Each tick mark on the ordinate of the histograms represents 100 Hz; thus, 2 ticks represent 200 Hz. Note the high spontaneous SS activities in PCs. The time windows for calculation of PDs were as follows: A and E: −100 to 0 ms relative to movement onset; B and G: −100 to 100 ms relative to movement onset. A significant PD (black arrow beside contour plot) was obtained only in B PRO, 99.7°. C: start and finish time of activity suppression in the sample cell presented in A, PRO. Note that these times changed with movement direction. The finish time for the up+rt direction was 265 ms relative to movement onset and is off scale. D: distribution of the earliest start time and the latest finish time of suppressive modulation observed in PCs (n = 25 for PRO, 20 for SUP) that exhibited suppressive modulation in >5 directions. The 2 dark gray bars indicate start times for the 2 postures (darker for PRO than SUP), and the 2 light gray bars indicate finish times. The leftmost bar includes PCs with suppression times earlier than −300 ms, and the rightmost bar includes PCs with suppression times later than 300 ms relative to movement onset. E and F: mean activity for 100 ms before movement onset (E) and in more precise time windows (F) for the neuron shown in A. Movement direction is indicated on the abscissae. Mean firing rate for each direction is indicated on the ordinate. Note that the ordinate scales differ for different graphs. The thick, smooth gray lines show significant cosine tuning, and the dashed vertical lines indicate the estimated PD. G and H: mean activity for 100 ms before to 100 ms after movement onset (G) and in more precise time windows (H) for the neuron shown in B. Note that the graphs in H show time periods before and after movement onset only for SUP. The lines in H have the same meaning as in F.

